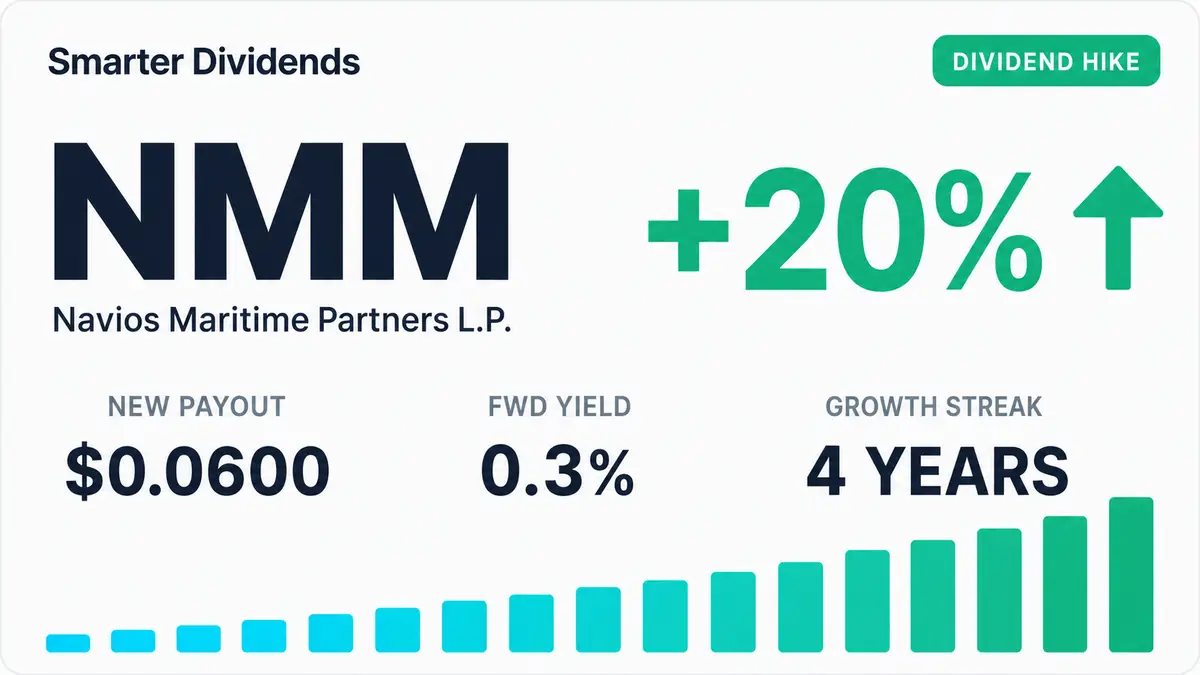
Navios Maritime Partners Raises Distribution 20.0% to $0.06
Navios Maritime Partners lifts its quarterly payout to $0.06, while the 0.27% forward yield remains below the Industrials sector median of 1.61%.
 NMM — Navios Maritime Partners L.P.
Key takeaways
- Navios Maritime Partners raised its quarterly distribution 20.0% to $0.06 per unit from $0.05.
- The new annual distribution is $0.24 per unit, providing $24.00 of annual income for every 100 units.
- The distribution uses 1% of earnings and carries a SmarterDividends safety grade of B with a score of 67.
- The 0.27% forward yield is below the Industrials sector median forward yield of 1.61%.
Navios Maritime Partners L.P. raised its quarterly cash distribution 20.0% to $0.06 per unit from $0.05, lifting the annual rate to $0.24. The units traded ex-distribution on May 11, 2026. The increase applied from the first quarter of 2026, according to the partnership’s distribution announcement.
Why the dividend changed
Navios explicitly tied the increase primarily to savings from its common-unit repurchase program. Repurchases reduce the number of units among which a distribution must be divided, allowing the partnership to raise the per-unit payment without a proportionate increase in the total cash outlay. The board approved the higher rate alongside the fourth-quarter and full-year 2025 results.
The board did not establish a fixed payout policy. Navios said future declarations remain discretionary and will depend on cash requirements, market opportunities, credit-agreement restrictions and other debt obligations. That language matters because shipping is capital intensive and earnings can move sharply with charter rates, vessel values and trade patterns.
The operating backdrop was supportive. Navios subsequently reported first-quarter 2026 revenue of $357.0 million, net income of $106.3 million, earnings of $3.64 per common unit and net cash from operating activities of $126.6 million. Net income increased from $41.7 million in the comparable period, helped by higher charter-equivalent rates and gains on vessel sales, according to the partnership’s Form 6-K.
Navios was also recycling substantial capital rather than directing most earnings to distributions. During 2026 through its first-quarter report, it committed $616.3 million to six newbuilding vessels and reported $189.3 million of gross proceeds from five vessel sales. It had $4.1 billion of contracted revenue as of May 2026. Those commitments help explain why the board paired a higher per-unit distribution with a low earnings payout rather than making a larger increase. The fleet transactions and charter coverage are detailed in the first-quarter results.
Dividend track record
The increase breaks a long period in which the quarterly rate held at $0.05. The recorded payments with ex-dividend dates of May 9, August 9 and November 12, 2024 were each $0.05, as were the payments dated February 10, May 9 and August 11, 2025. The payments dated May 11 and August 10, 2026 were both $0.06, showing that the higher rate continued into a second quarter.
The full-year totals show both stability and the legacy of an earlier reduction. Navios paid $0.70 per unit in 2020, followed by $0.20 in 2021, a decline of 71.4%. The last annual cut year was 2020, with its full-year effect reflected in the lower 2021 total. Annual payments then remained unchanged at $0.20 in 2022, 2023 and 2024. The recorded 2025 total was $0.15 from three payments, down 25.0%, although the listed quarterly rate remained $0.05.
The current dividend-growth streak is 4 years, while the five-year annualized growth rate is unchanged. Taken together, the figures describe a distribution that was reset sharply, held flat for several years and has now moved modestly higher.
Is the dividend covered?
The distribution consumes 1% of earnings. That is a wide accounting-earnings coverage margin and leaves most reported profit available for fleet investment, debt service, repurchases and liquidity. It also limits the immediate financial burden of the 20.0% increase.
SmarterDividends rates the dividend B, with a safety score of 67. That falls within the safe (66-79) range, indicating that the present payment has solid support from earnings and a conservative payout. The grade does not remove the risks associated with shipping cycles, vessel commitments or the board’s discretion over future distributions.
Yield and valuation
At a unit price of $90.01, Navios has a forward yield of 0.27%. That is well below the Industrials sector median forward yield of 1.61%, making the distribution a relatively small component of the security’s current return profile.
The units recorded an 89.2% gain over one year. A rising unit price compresses the yield when the cash distribution grows more slowly, which helps explain why the yield remains low despite the higher quarterly rate. At the current annual rate, 100 units produce $24.00 in annual income.
What to watch
The next distribution declaration will show whether the board maintains the $0.06 rate while funding its fleet program. The earnings payout leaves substantial room on reported profit, but cash demands include vessel purchases, scheduled debt obligations and the timing of asset-sale proceeds.
Fleet execution is the other concrete monitor. Navios agreed to acquire newbuilding tankers and dry-bulk vessels while selling older ships, and it secured multiyear charters for several additions. Future quarterly filings will show how those deliveries, disposals and charter contracts affect operating cash generation.
Management also identified geopolitical disruption and changes in strategic supply chains as factors affecting shipping routes. Developments around the Strait of Hormuz, charter rates and vessel utilization therefore remain relevant to earnings coverage, even though the distribution currently represents only 1% of earnings.
NMM dividend data
From the SmarterDividends dataset, updated daily
- Forward yield
- 0.27%
- Payout ratio
- 1%
- Growth streak
- 0 yrs
- Safety grade
- B · 67/100
| Ex-dividend date | Amount | Change |
|---|---|---|
| Aug 10, 2026 | $0.0600 | +0.0% |
| May 11, 2026 | $0.0600 | +20.0% |
| Aug 11, 2025 | $0.0500 | +0.0% |
| May 9, 2025 | $0.0500 | +0.0% |
| Feb 10, 2025 | $0.0500 | +0.0% |
| Nov 12, 2024 | $0.0500 | +0.0% |
| Aug 9, 2024 | $0.0500 | +0.0% |
| May 9, 2024 | $0.0500 | +0.0% |
Frequently asked questions
When was the NMM distribution ex-dividend?
The $0.06 distribution had an ex-dividend date of May 11, 2026.
How much is the new NMM distribution per year?
The quarterly rate of $0.06 produces an annual distribution of $0.24 per unit.
Is NMM’s dividend safe?
SmarterDividends gives the distribution a B safety grade and a score of 67, classified as safe (66-79). Its earnings payout ratio is 1%.
What is NMM’s forward dividend yield?
NMM’s forward yield is 0.27% at a unit price of $90.01, compared with the Industrials sector median forward yield of 1.61%.
How much annual income do 100 NMM units produce?
At the current annual distribution, 100 units produce $24.00 in annual income.
Sources
See NMM's full dividend profile
Yield, payout, safety score, history and the next ex-dividend date.
View NMMEvery dividend increases this month, with the data behind it: Dividend Increases, June 2026.
More dividend news
GE HealthCare Raises Quarterly Dividend 14.3% to $0.04
GE HealthCare raised its quarterly dividend 14.3% to $0.04, payable November 13, while a 3% earnings payout supports a B safety grade for GEHC shareholders.

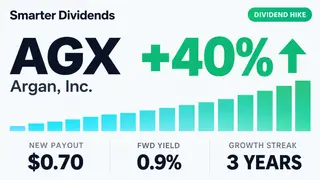
Argan Raises Quarterly Dividend 40.0% to $0.70
Argan lifted its quarterly dividend 40.0% to $0.70, backed by record fiscal second-quarter results, robust power demand and a 16% payout ratio.
RPM International Raises Dividend 5.6%, Extends 53-Year Streak
RPM International lifted its quarterly dividend 5.6% to $0.57, extending a 53-year record as earnings coverage and cash flow remain solid despite mixed demand.

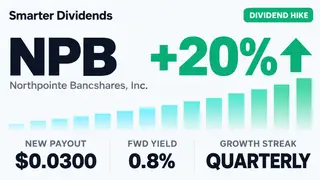
Northpointe Bancshares Raises Quarterly Dividend 20.0% to $0.03
Northpointe lifts its quarterly dividend 20.0% to $0.03 per share, while a 4% earnings payout ratio signals ample reported profit coverage.

Farmers & Merchants Bancorp Raises Dividend Payment 8.7% to $0.25
FMAO's third-quarter payment rises 8.7% to $0.25, including a special dividend, while earnings and capital reinforce its long payout record.