
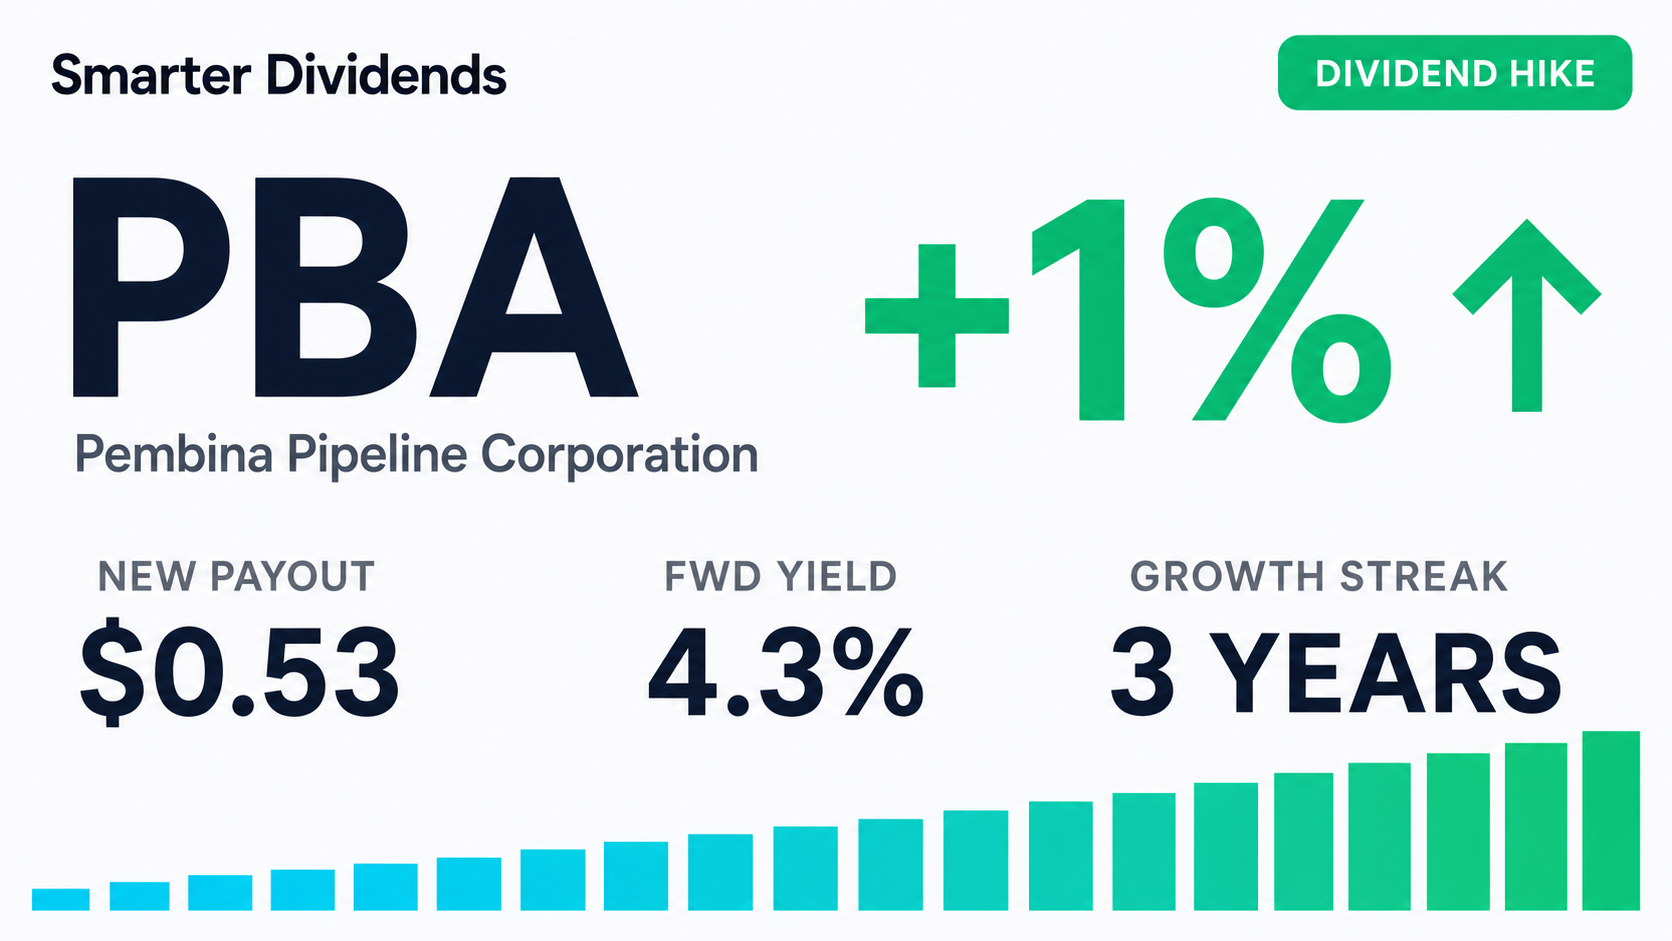
Pembina Pipeline Corporation
PBAEnergy · Stock · quarterly payer
Forward Yield
4.01%
Annual Dividend
$2.06
Payout Ratio
107%
5-Yr Growth
26.3%
Ex-Date
Jun 15, 2026
Frequency
Quarterly
Summary
As of July 2026, Pembina Pipeline Corporation (PBA) yields 4.01% ($2.06 per share annually), with a blended fair-value estimate of $49.06 — -4% downside, so it screens as fairly valued. Dividend safety grade: D (49/100). 3 years of dividend growth.
Is PBA a good dividend stock?
MixedPembina Pipeline Corporation (PBA) pays a quarterly dividend yielding 4.01% ($2.06/yr), with 3 years of growth and a dividend-safety grade of D. The picture is mixed — the dividend pays, but safety or growth signals are weaker than ideal.
Advantages
- Strong 26.3% 5-yr dividend growth
- 68% total price return over 5 years
Risks
- Cut its dividend in 2018
- Elevated payout ratio (107%)
- Below-average dividend safety score
Key Data
- Dividend Yield
- 4.01%
- Payout Ratio
- 107%
- Annual Dividend
- $2.06
- 5-Yr Avg Growth
- 26.3%
- Ex-Dividend Date
- Jun 15, 2026
- Years of Growth
- 3
- Frequency
- quarterly
- Beta
- 0.70
- Market Cap
- $29.5B
- P/E Ratio
- 27.4
- 5-Yr Total Return
- 68%
- 52-Week Range
- $35.45 – $51.56
- Dividend Safety
- D · 49/100
- Ever Cut?
- Yes (2018)
Frequently Asked Questions
PBA Price — Last 12 Months
Daily close
Price Return
1 Year
+36%
3 Years
+65%
5 Years
+68%
52-Week Range
$35.45 – $51.56
Price change over each period (excludes dividends). Past performance doesn't guarantee future results.
What is PBA worth?
Fairly valuedmedium confidenceOur blended fair-value estimate for Pembina Pipeline Corporation is $49.06 per share, versus a market price of $51.29. That implies the stock is roughly fairly priced.
Fair Value
$49.06
Current Price
$51.29
Gap
-4%
Margin of Safety
-5%
How we get there
Discounted cash flow
Discounts projected free cash flow back to today.
Dividend discount
Discounts the future dividend stream back to today.
Earnings multiple (Graham)
Graham's earnings-multiple formula, anchored to bond yields.
At today's price, the market is pricing in about 2.4% annual free-cash-flow growth. We model 5.2% — below our estimate, leaving room for upside if the business executes.
Assumptions: 7.8% discount rate (CAPM), 5.2% stage-1 growth, 2.5% terminal growth, $1.87 EPS, $2.06 annual dividend. Updated weekly.
Fair-value estimates are model output for educational purposes only — not investment advice or a price target.
PBA Dividend Safety Score
Risky
SmarterDividends' proprietary score, backtested against which dividends were actually cut over 15+ years (0.78 AUC). It blends a validated cut-risk model (growth streak, cut history) with current payout, cash-flow and debt. Higher is safer · not investment advice.
Dividend Growth
Total dividends per share by year
Dividend History
| Ex-Date | Pay Date | Amount | Type |
|---|---|---|---|
| Jun 15, 2026 | — | $0.5250 | regular |
| Mar 16, 2026 | — | $0.5180 | regular |
| Jun 16, 2025 | — | $0.5230 | regular |
| Mar 17, 2025 | — | $0.4800 | regular |
| Dec 16, 2024 | — | $0.4850 | regular |
| Sep 16, 2024 | — | $0.5080 | regular |
| Jun 17, 2024 | — | $0.5030 | regular |
| Mar 14, 2024 | — | $0.4960 | regular |
| Dec 14, 2023 | — | $0.4940 | regular |
| Sep 14, 2023 | — | $0.4930 | regular |
| Jun 14, 2023 | — | $0.5010 | regular |
| Mar 14, 2023 | — | $0.4750 | regular |
| Dec 14, 2022 | — | $0.1610 | regular |
| Nov 25, 2022 | — | $0.1630 | regular |
Income Calculator
At $2.06 / yr per share