
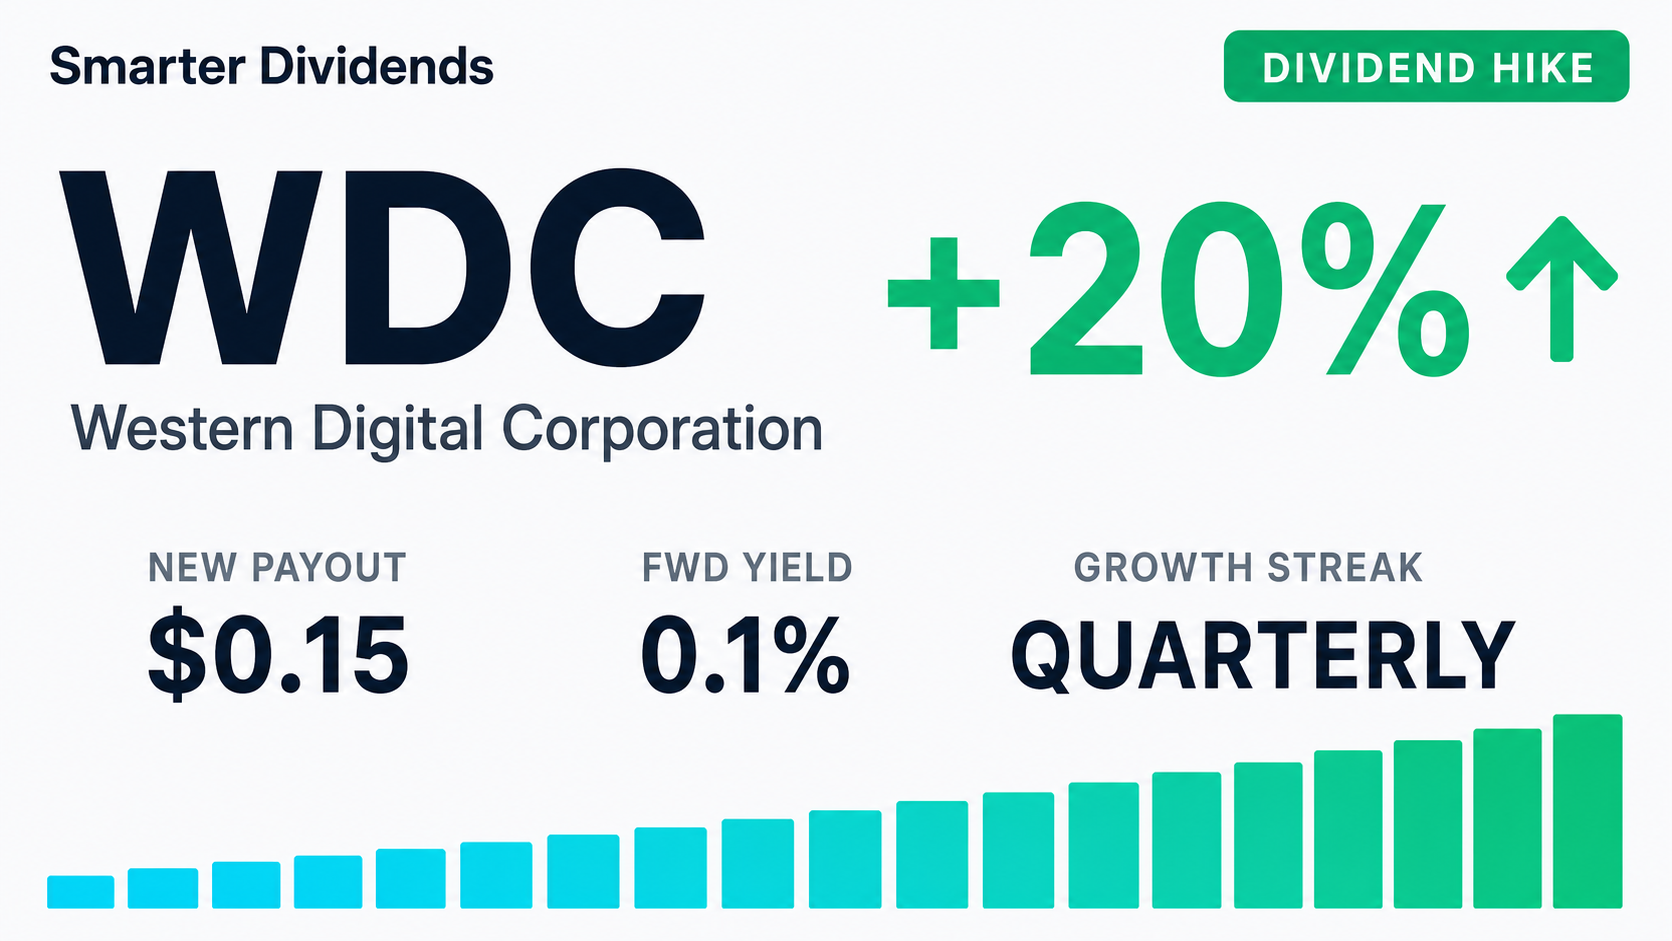
Western Digital Corporation
WDCTechnology · Stock · quarterly payer
Forward Yield
0.13%
Annual Dividend
$0.60
Payout Ratio
3%
5-Yr Growth
-22.1%
Ex-Date
Jun 5, 2026
Frequency
Quarterly
Summary
As of July 2026, Western Digital Corporation (WDC) yields 0.13% ($0.60 per share annually), with a blended fair-value estimate of $589.37 — +24% upside, so it screens as undervalued. Dividend safety grade: C (58/100).
Is WDC a good dividend stock?
Yes, with caveatsWestern Digital Corporation (WDC) pays a quarterly dividend yielding 0.13% ($0.60/yr), with 0 years of growth and a dividend-safety grade of C. It's a solid income payer, but check the caveats below before buying.
Advantages
- Comfortable payout ratio (3%)
- 899% total price return over 5 years
Risks
- Cut its dividend in 2025
- Dividend has been shrinking, not growing
Key Data
- Dividend Yield
- 0.13%
- Payout Ratio
- 3%
- Annual Dividend
- $0.60
- 5-Yr Avg Growth
- -22.1%
- Ex-Dividend Date
- Jun 5, 2026
- Years of Growth
- 0
- Frequency
- quarterly
- Beta
- 2.17
- Market Cap
- $168.0B
- P/E Ratio
- 28.6
- 5-Yr Total Return
- 899%
- 52-Week Range
- $66.04 – $799.87
- Dividend Safety
- C · 58/100
- Ever Cut?
- Yes (2025)
Frequently Asked Questions
WDC Price — Last 12 Months
Daily close
Price Return
1 Year
+494%
3 Years
+1303%
5 Years
+899%
52-Week Range
$66.04 – $799.87
Price change over each period (excludes dividends). Past performance doesn't guarantee future results.
What is WDC worth?
Undervaluedlow confidenceOur blended fair-value estimate for Western Digital Corporation is $589.37 per share, versus a market price of $477.22. That implies 24% of upside — a margin of safety of about 19%.
Fair Value
$589.37
Current Price
$477.22
Upside
+24%
Margin of Safety
19%
How we get there
Earnings multiple (Graham)
Graham's earnings-multiple formula, anchored to bond yields.
At today's price, the market is pricing in about 40.0% annual free-cash-flow growth. We model 20.0% — so the price already assumes faster growth than we think is likely.
Assumptions: 12.0% discount rate (CAPM), 20.0% stage-1 growth, 2.5% terminal growth, $16.70 EPS, $0.60 annual dividend. Updated weekly.
Fair-value estimates are model output for educational purposes only — not investment advice or a price target.
WDC Dividend Safety Score
Borderline
SmarterDividends' proprietary score, backtested against which dividends were actually cut over 15+ years (0.78 AUC). It blends a validated cut-risk model (growth streak, cut history) with current payout, cash-flow and debt. Higher is safer · not investment advice.
Dividend Growth
Total dividends per share by year
Dividend History
| Ex-Date | Pay Date | Amount | Type |
|---|---|---|---|
| Jun 5, 2026 | — | $0.1500 | regular |
| Mar 5, 2026 | — | $0.1250 | regular |
| Dec 4, 2025 | — | $0.1250 | regular |
| Sep 4, 2025 | — | $0.1000 | regular |
| Jun 4, 2025 | — | $0.1000 | regular |
| Apr 2, 2020 | — | $0.3779 | regular |
| Jan 2, 2020 | — | $0.3779 | regular |
| Oct 3, 2019 | — | $0.3779 | regular |
| Jun 27, 2019 | — | $0.3779 | regular |
| Mar 28, 2019 | — | $0.3779 | regular |
| Dec 27, 2018 | — | $0.3779 | regular |
| Sep 27, 2018 | — | $0.3779 | regular |
| Jun 28, 2018 | — | $0.3779 | regular |
| Mar 28, 2018 | — | $0.3779 | regular |
Income Calculator
At $0.60 / yr per share