Goldman Sachs BDC Pays $0.32 Base Dividend After $0.03 Supplement
GSBD's latest $0.32 base dividend follows a $0.03 supplemental payment, while a 265% earnings payout ratio keeps coverage in focus for investors.
 GSBD — Goldman Sachs BDC, Inc.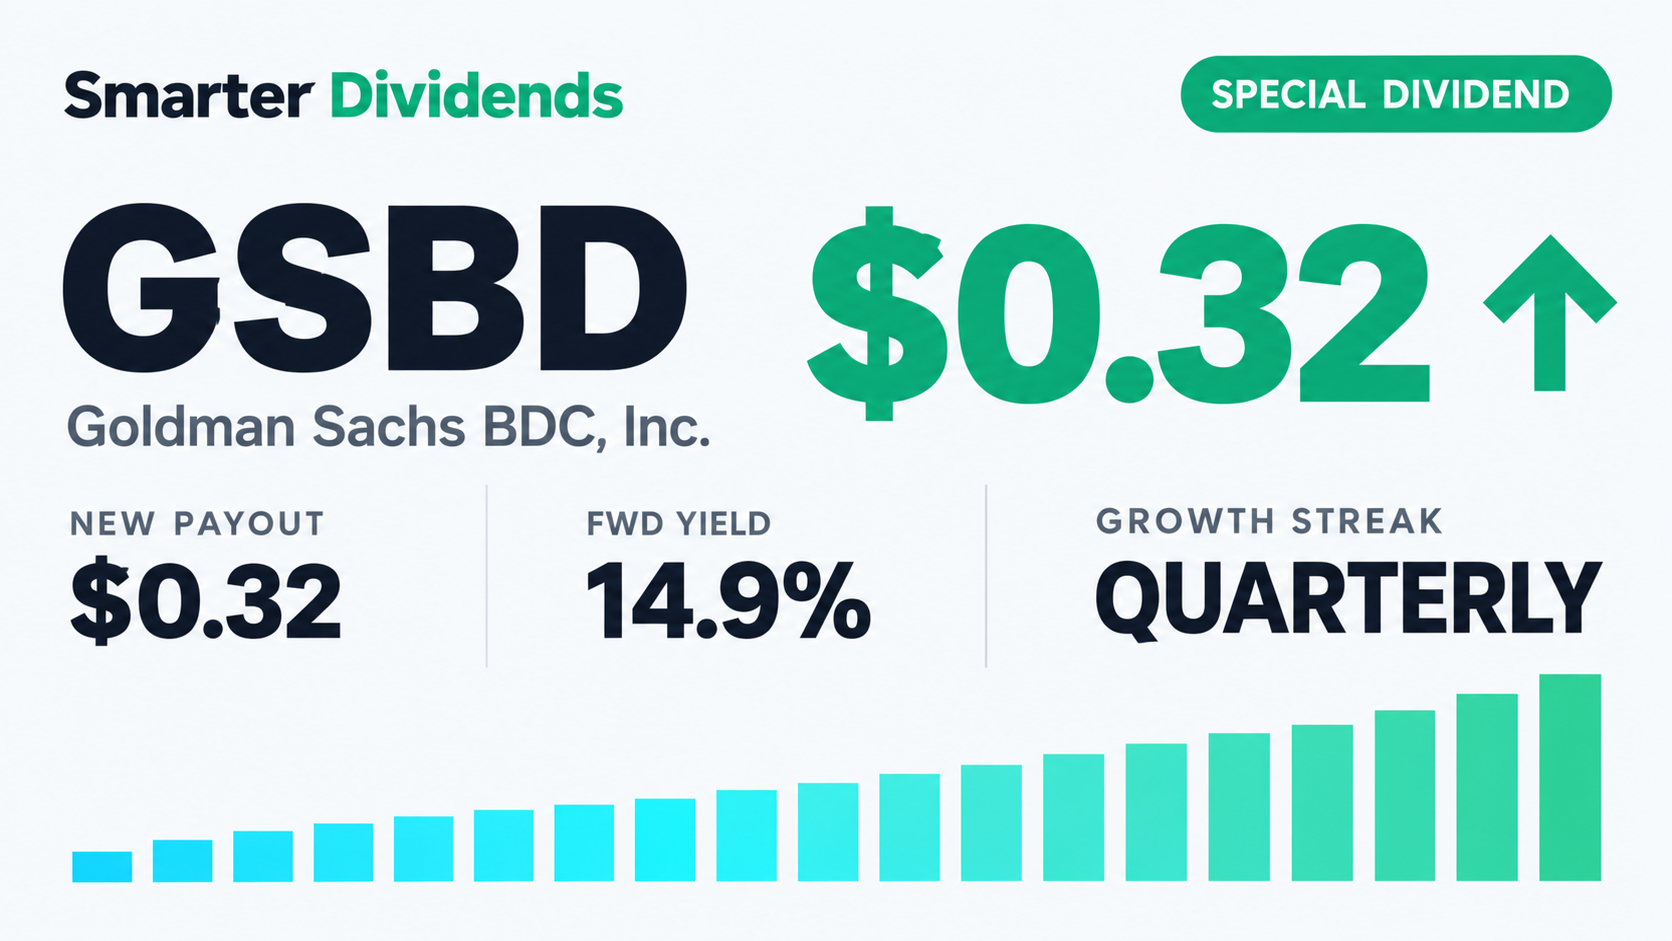
Key takeaways
- The latest $0.32 payment was 966.7% above the preceding $0.03 supplemental dividend, but it represents a return to the base distribution.
- GSBD’s annual dividend is $1.41 per share, producing $141.00 of annual income per 100 shares.
- The 265% earnings payout ratio contributes to a dividend safety score of 47 and a D grade.
- The 14.86% forward yield exceeds the Financial Services sector median of 5.76%.
Goldman Sachs BDC’s latest dividend was $0.32 per share, up 966.7% from the immediately preceding $0.03 payment. The shares traded ex-dividend on September 30, 2026. This is a special comparison: the sequence moves from a supplemental distribution to a quarterly base dividend, not from one regular quarterly rate to another.
Why the dividend changed
Goldman Sachs BDC uses a two-part distribution framework consisting of a quarterly base dividend and a variable supplemental dividend. The base distribution is declared for the relevant quarter, while the supplemental distribution is declared later and depends on measurement tests and board approval. The company’s dividend history classifies the $0.32 payment as base and the preceding $0.03 payment as supplemental.
That classification explains most of the apparent 966.7% increase. The $0.32 amount restores the base component after a smaller supplemental payment appeared immediately before it in the payment chronology. It does not represent a 966.7% increase in the recurring quarterly base rate.
The latest quarterly release provides the operating context. Investment income increased sequentially as certain investments returned to accrual status, while lower incentive fees reduced expenses. Net asset value nevertheless declined, and credit performance remained mixed: non-accrual investments improved as a share of the portfolio at fair value but worsened at amortized cost. Repayments and asset sales also reduced leverage below management’s target after quarter-end.
The board separately authorized a new stock-repurchase program. Together, the dividend framework and repurchase authorization show that capital returns are being managed through several channels rather than through the base dividend alone.
Dividend track record
The payment record shows a regular base dividend interspersed with smaller supplemental distributions. The September 30, 2026 payment of $0.32 followed $0.03 on August 31, 2026 and $0.32 on June 30, 2026. Earlier payments included $0.32 on March 31, 2026 and $0.03 on March 9, 2026. Investors therefore need to distinguish payment order from changes in the underlying base rate.
Annual totals have not followed a steady growth path. Distributions totaled $1.80 in 2020, rose 8.3% to $1.95 in 2021 and fell 7.7% to $1.80 in 2022. They remained unchanged at $1.80 in both 2023 and 2024 before increasing 4.4% to $1.88 in 2025.
The company has 0 consecutive years of dividend growth, and the last annual cut year was 2025. The base reduction that year was partly offset by additional distributions, which explains how the full-year total could increase even though the regular rate was cut. Over five years, dividend growth is recorded as a 38.4% annual decline. The pattern is variable income rather than a conventional annual-growth streak.
Is the dividend covered?
The earnings payout ratio is 265%. On that measure, the dividend substantially exceeds reported earnings, leaving limited protection if portfolio income weakens or credit losses rise.
SmarterDividends assigns the dividend a safety score of 47 and a grade of D, meaning unsafe (36-49). The grade reflects weak coverage rather than an imminent payment decision. The company’s variable supplemental framework gives the board flexibility to align extra distributions with quarterly results, but that flexibility does not remove the coverage pressure shown by the earnings payout ratio.
The latest results add nuance. Restored accruals supported investment income, while several holdings remained on non-accrual and another borrower was added because of financial underperformance. The company’s quarterly filing confirms that portfolio credit quality and realized and unrealized investment changes can materially affect reported earnings.
Yield and valuation
GSBD’s forward yield is 14.86%, compared with the Financial Services sector median of 5.76%. The wide premium compensates for a payment record without a growth streak and coverage metrics that place the dividend in the unsafe range.
At a share price of $9.09, SmarterDividends estimates fair value at $12.57 and classifies the shares as undervalued, with 32% upside to that estimate. The valuation gap and dividend safety measure address different issues: the former compares market price with estimated value, while the latter assesses the risk surrounding the cash distribution.
What to watch
The next quarterly report will show whether restored accruals continue supporting investment income and whether the portfolio’s non-accrual balance improves. Net asset value, leverage, repayments and realized or unrealized investment losses are also important because each can affect the board’s capacity to maintain the base dividend.
Investors should also separate the quarterly base declaration from any later supplemental distribution. Under the company’s framework, supplemental payments depend on measurement tests and board approval, so their timing and amount can vary. The current annual dividend is $1.41 per share, equal to $141.00 of annual income per 100 shares, but the 265% earnings payout ratio and D safety grade keep coverage central to the next review.
GSBD dividend data
From the SmarterDividends dataset, updated daily
- Forward yield
- 14.86%
- Payout ratio
- 265%
- Growth streak
- 0 yrs
- Safety grade
- D · 47/100
| Ex-dividend date | Amount | Change |
|---|---|---|
| Sep 30, 2026 | $0.3200 | +966.7% |
| Aug 31, 2026 | $0.0300 | -90.6% |
| Jun 30, 2026 | $0.3200 | +0.0% |
| Mar 31, 2026 | $0.3200 | +966.7% |
| Mar 9, 2026 | $0.0300 | -90.6% |
| Dec 31, 2025 | $0.3200 | +700.0% |
| Nov 28, 2025 | $0.0400 | -91.7% |
| Sep 30, 2025 | $0.4800 | +1500.0% |
Frequently asked questions
How much is Goldman Sachs BDC’s latest dividend?
The latest GSBD dividend is $0.32 per share. It followed a $0.03 payment, an increase of 966.7% in the payment sequence.
When did GSBD most recently trade ex-dividend?
The most recent recorded ex-dividend date was September 30, 2026, for a $0.32 payment.
How much does GSBD pay annually?
The annual dividend is $1.41 per share. That equals $141.00 of annual income per 100 shares.
Is GSBD’s dividend safe?
SmarterDividends assigns GSBD a safety score of 47 and a D grade, meaning unsafe (36-49). The earnings payout ratio is 265%.
What is GSBD’s dividend yield?
GSBD’s forward yield is 14.86%, compared with the Financial Services sector median of 5.76%.
Sources
See GSBD's full dividend profile
Yield, payout, safety score, history and the next ex-dividend date.
View GSBDEvery initiation and special dividend this month, with the data behind it: Dividend Initiations and Special Dividends, October 2026.
More dividend news
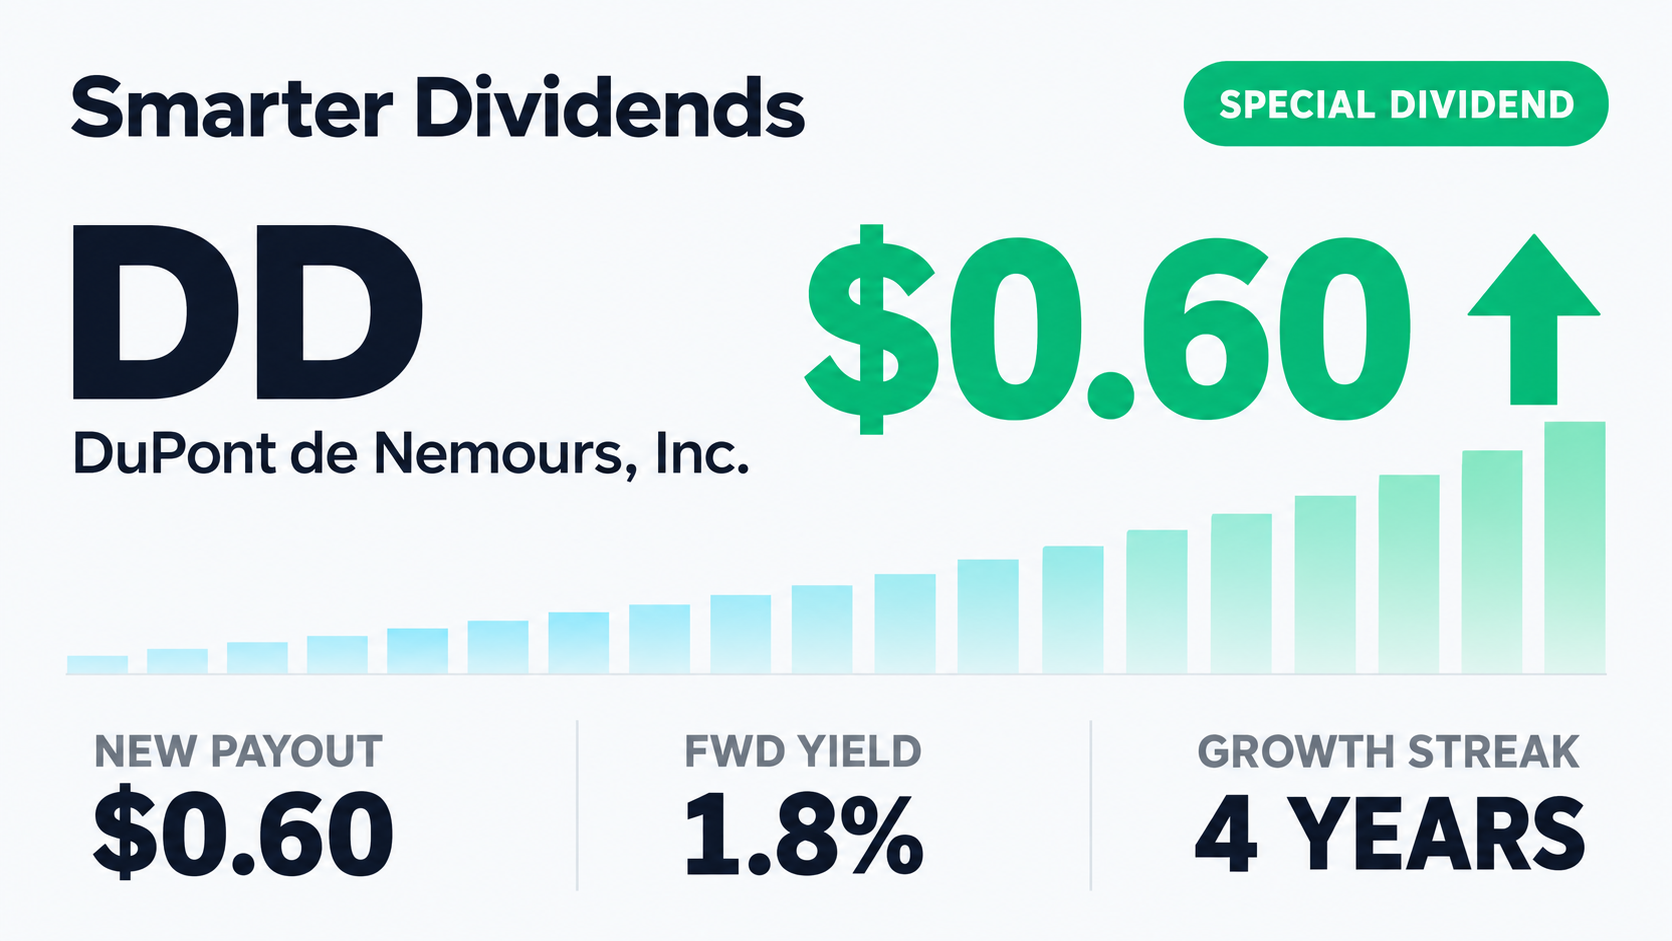
DuPont Resets Quarterly Dividend to $0.60 After Reverse Split
DuPont's quarterly dividend is $0.60 after a reverse split, while a 130% earnings payout ratio contrasts with a B safety grade and 1.83% yield.

Gold.com Declares $1.20 Special Dividend
Gold.com’s $1.20-per-share special dividend went ex-dividend Sept. 16, supplementing its regular quarterly payout.

TORM Special Dividend Jumps 242.9% to $2.40
TORM’s $2.40 special dividend reflects record tanker earnings, while a 12.85% forward yield and C safety grade show the payout remains variable.

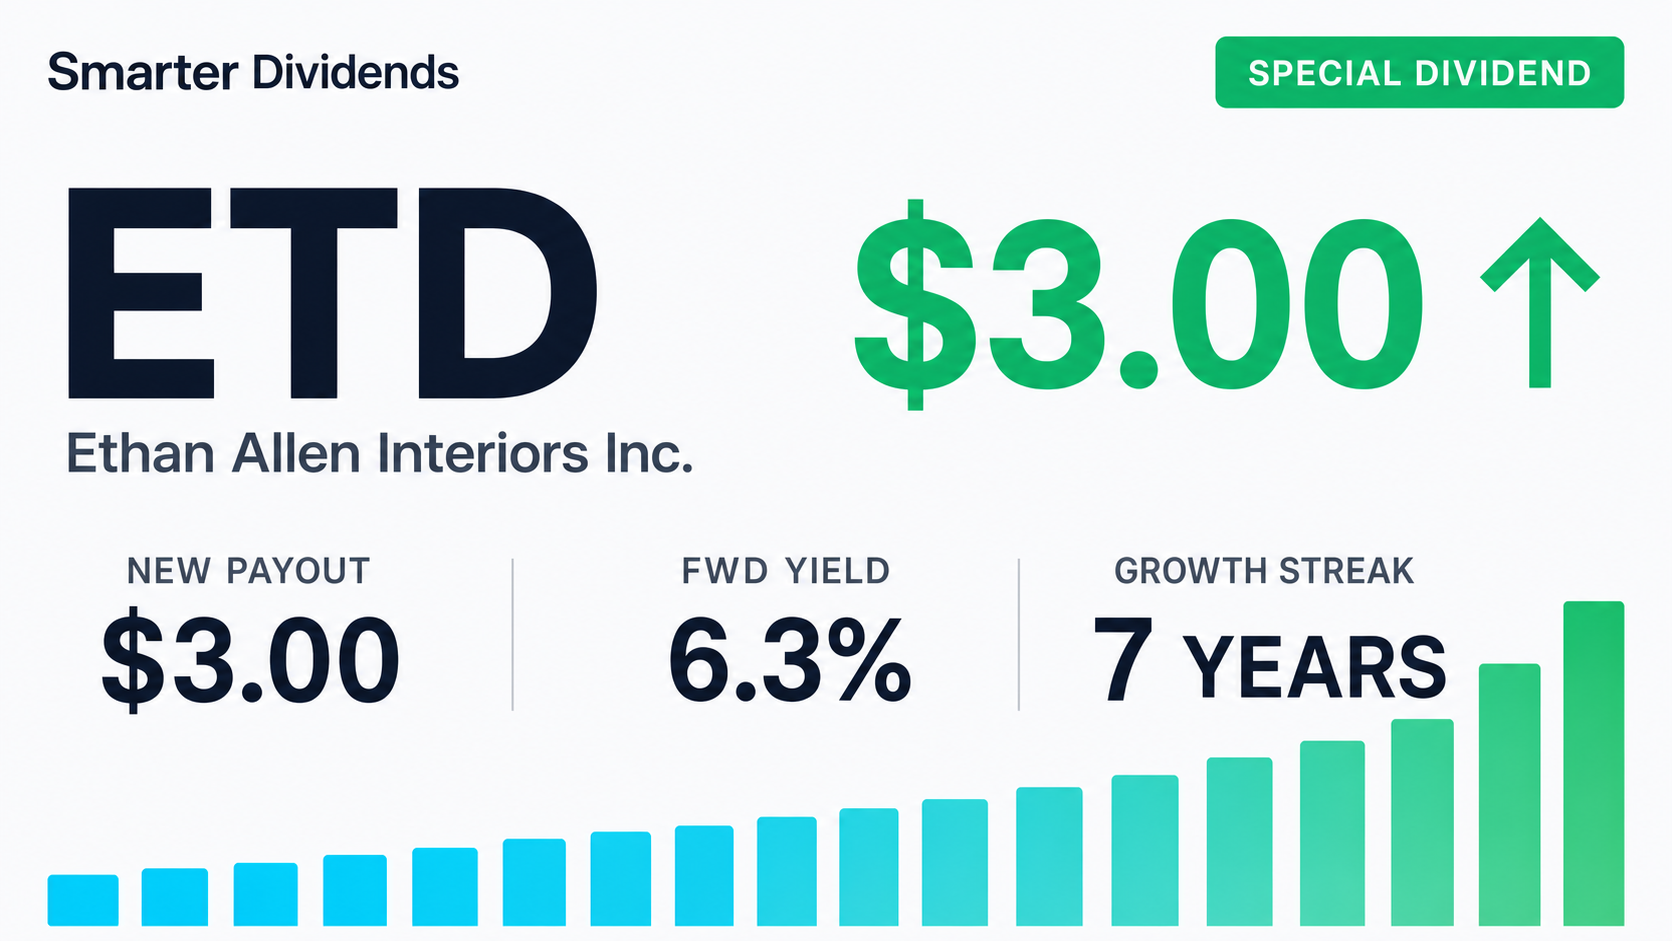
Ethan Allen Declares $3 Special Dividend
Ethan Allen’s $3-per-share special dividend goes ex-dividend Sept. 3, marking a sizable one-time return of capital.

Presidio Production Sets $0.338 Special Dividend
Presidio Production Company’s special dividend rises from $0.101 per share, carrying an Aug. 31 ex-dividend date.