
The Travelers Companies, Inc.
TRV20 yrs growthFinancial Services · Stock · quarterly payer
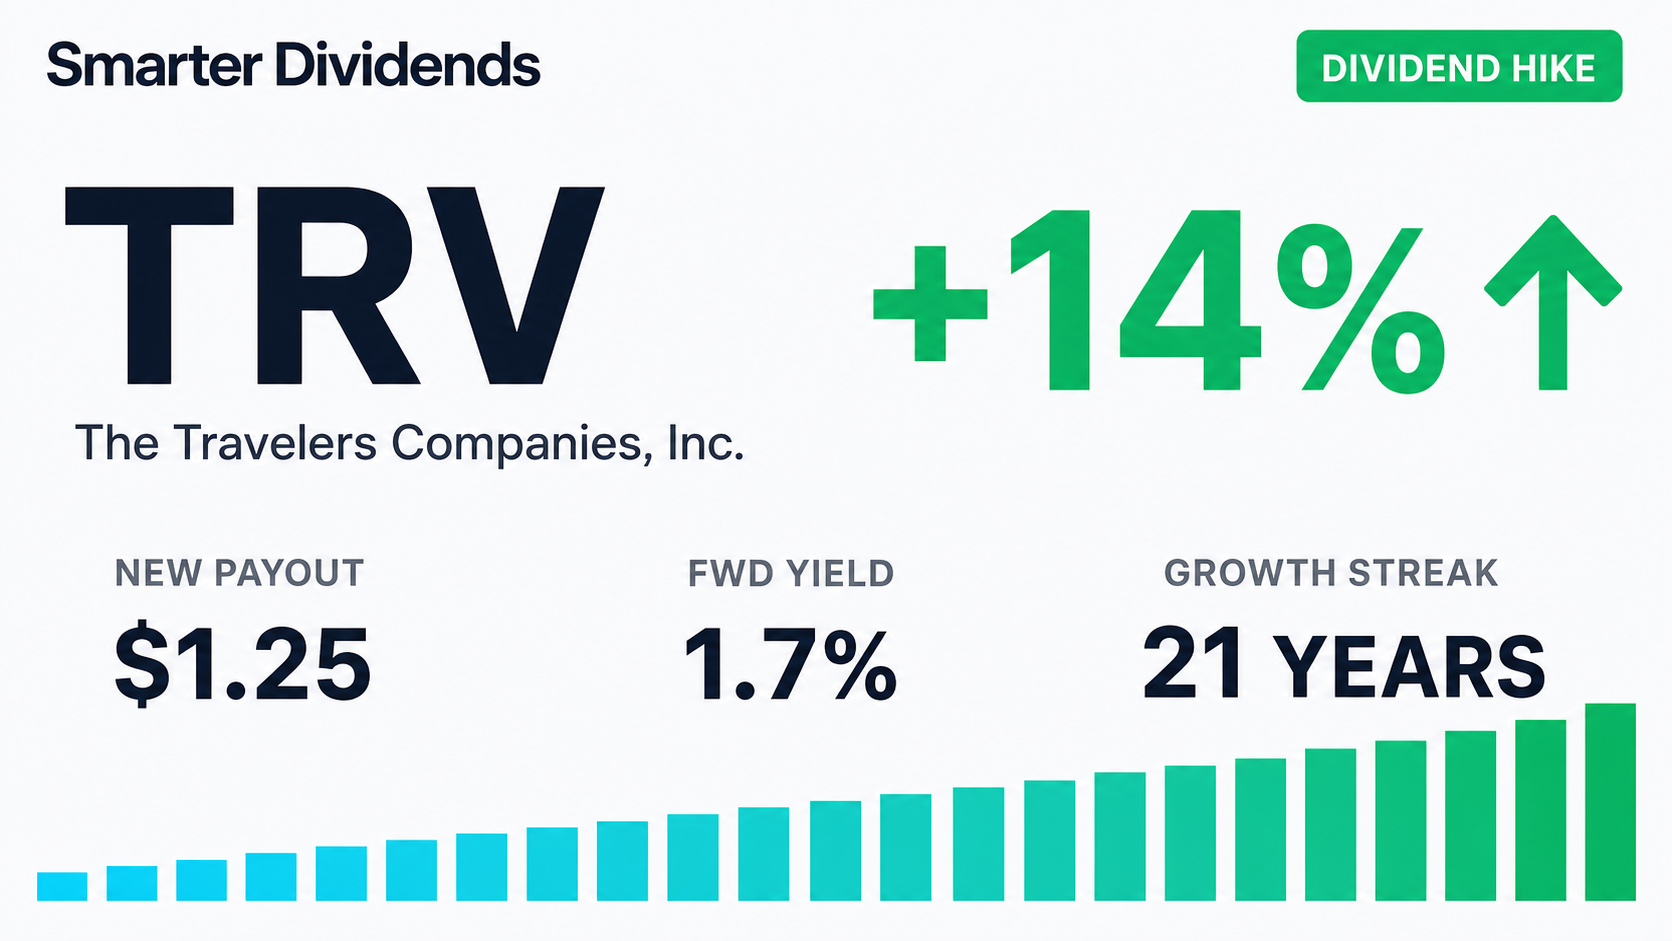
Forward Yield
1.36%
Annual Dividend
$5.00
Payout Ratio
12%
5-Yr Growth
5.2%
Ex-Date
Sep 10, 2026
Frequency
Quarterly
Summary
As of July 2026, The Travelers Companies, Inc. (TRV) yields 1.36% ($5.00 per share annually), with a blended fair-value estimate of $747.98 — +103% upside, so it screens as undervalued. Dividend safety grade: A (94/100). 20 years of dividend growth.
Is TRV a good dividend stock?
YesThe Travelers Companies, Inc. (TRV) pays a quarterly dividend yielding 1.36% ($5.00/yr), with 20 years of growth and a dividend-safety grade of A. It scores well across payout coverage, growth history and safety — a dependable income holding.
Advantages
- 20 consecutive years of dividend growth
- Comfortable payout ratio (12%)
- Strong 5.2% 5-yr dividend growth
- 131% total price return over 5 years
- Top-tier dividend safety score
Risks
- Cut its dividend in 2004
Key Data
- Dividend Yield
- 1.36%
- Payout Ratio
- 12%
- Annual Dividend
- $5.00
- 5-Yr Avg Growth
- 5.2%
- Ex-Dividend Date
- Sep 10, 2026
- Years of Growth
- 20
- Frequency
- quarterly
- Beta
- 0.47
- Market Cap
- $81.3B
- P/E Ratio
- 9.9
- 5-Yr Total Return
- 131%
- 52-Week Range
- $252.26 – $370.43
- Dividend Safety
- A · 94/100
- Ever Cut?
- Yes (2004)
Frequently Asked Questions
TRV Price — Last 12 Months
Daily close
Price Return
1 Year
+36%
3 Years
+129%
5 Years
+131%
52-Week Range
$252.26 – $370.43
Price change over each period (excludes dividends). Past performance doesn't guarantee future results.
What is TRV worth?
Undervaluedlow confidenceOur blended fair-value estimate for The Travelers Companies, Inc. is $747.98 per share, versus a market price of $368.98. That implies 103% of upside — a margin of safety of about 51%.
Fair Value
$747.98
Current Price
$368.98
Upside
+103%
Margin of Safety
51%
How we get there
Discounted cash flow
Discounts projected free cash flow back to today.
Dividend discount
Discounts the future dividend stream back to today.
At today's price, the market is pricing in about -10.0% annual free-cash-flow growth. We model 17.3% — below our estimate, leaving room for upside if the business executes.
Assumptions: 9.3% discount rate (CAPM), 17.3% stage-1 growth, 2.5% terminal growth, $37.19 EPS, $5.00 annual dividend. Updated weekly.
Fair-value estimates are model output for educational purposes only — not investment advice or a price target.
TRV Dividend Safety Score
Very Safe
SmarterDividends' proprietary score, backtested against which dividends were actually cut over 15+ years (0.78 AUC). It blends a validated cut-risk model (growth streak, cut history) with current payout, cash-flow and debt. Higher is safer · not investment advice.
Dividend Growth
Total dividends per share by year
Dividend History
| Ex-Date | Pay Date | Amount | Type |
|---|---|---|---|
| Jun 10, 2026 | — | $1.2500 | regular |
| Mar 10, 2026 | — | $1.1000 | regular |
| Dec 10, 2025 | — | $1.1000 | regular |
| Sep 10, 2025 | — | $1.1000 | regular |
| Jun 10, 2025 | — | $1.1000 | regular |
| Mar 10, 2025 | — | $1.0500 | regular |
| Dec 10, 2024 | — | $1.0500 | regular |
| Sep 10, 2024 | — | $1.0500 | regular |
| Jun 10, 2024 | — | $1.0500 | regular |
| Mar 7, 2024 | — | $1.0000 | regular |
| Dec 7, 2023 | — | $1.0000 | regular |
| Sep 7, 2023 | — | $1.0000 | regular |
| Jun 8, 2023 | — | $1.0000 | regular |
| Mar 9, 2023 | — | $0.9300 | regular |
Income Calculator
At $5.00 / yr per share


