Adams Natural Resources Fund Raises Dividend 55.6% to $0.84
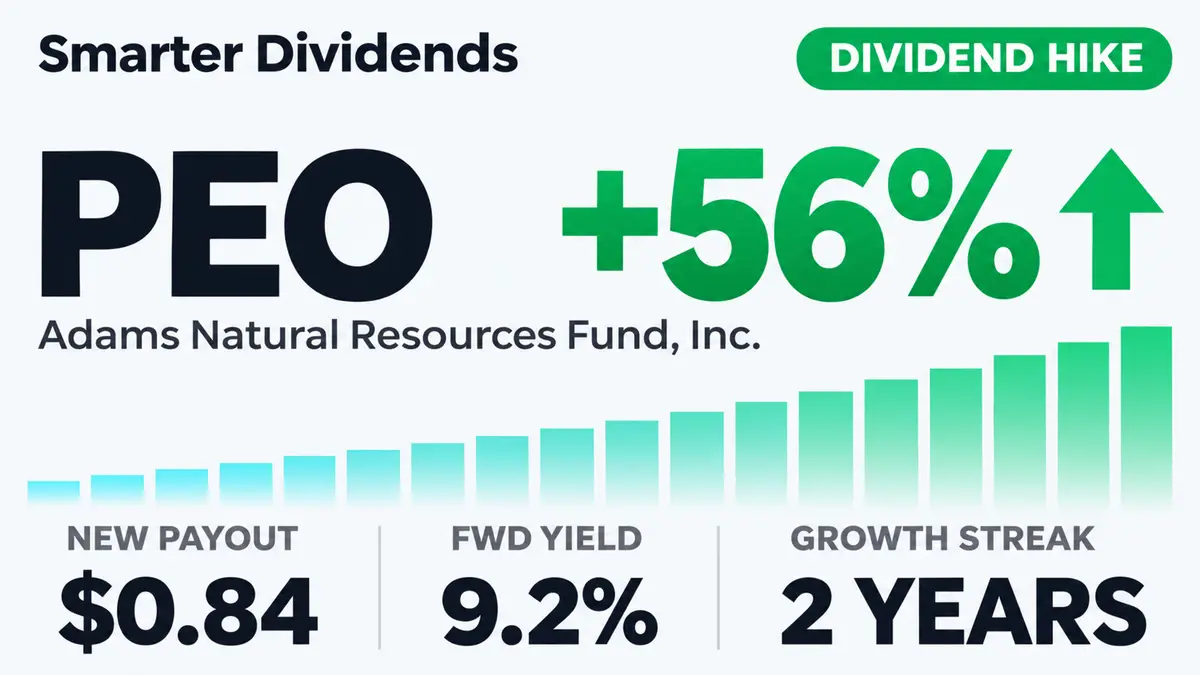
Adams Natural Resources Fund raised its quarterly distribution 55.6% to $0.84, lifting the forward yield to 9.15% with payment due December 4, 2026.
 PEO — Adams Natural Resources Fund, Inc.
Key takeaways
- PEO raised its quarterly distribution 55.6% to $0.84 per share from $0.54.
- The annual dividend is $2.39 per share, equal to $239.00 of annual income for 100 shares.
- The forward yield is 9.15%, compared with a 6.00% Financial Services sector median.
- SmarterDividends gives the dividend a safety score of 77 and a B grade.
Adams Natural Resources Fund increased its quarterly distribution 55.6% to $0.84 per share from $0.54. PEO shares traded ex-dividend on November 20, 2026, and the distribution is scheduled for payment on December 4, 2026.
Why the dividend changed
The increase reflects the mechanics of PEO’s managed distribution policy. The closed-end fund bases quarterly payments on average net asset value, while the fourth-quarter distribution is the greater of the regular NAV-linked amount or the sum required to meet federal tax-distribution requirements. Payments may come from investment income, realized capital gains or return of capital. The board can amend or end the policy. Adams Natural Resources Fund third-quarter report
Strong portfolio performance and realized gains provided the immediate business context. PEO reported a 34.4% total return on net asset value for the first nine months of 2026, slightly ahead of its blended energy-and-materials benchmark. Net realized gains were $38.7 million, compared with net investment income of $12.3 million. Adams Natural Resources Fund nine-month results
Management attributed the portfolio’s performance largely to energy holdings as higher oil prices and refining margins supported the sector. ConocoPhillips, Targa Resources and Freeport-McMoRan were among the contributors cited in the quarterly report. The jump in the distribution is therefore a policy-driven year-end payment supported by portfolio results, not the result of a split, merger or spin-off.
The fund’s declaration classified the distribution sources as estimates, with the final tax treatment to be determined after year-end. That distinction matters because a closed-end fund distribution can include capital gains and is not equivalent to an operating company paying a dividend solely from recurring earnings. PEO distribution declaration
Dividend track record
PEO’s recent quarterly payments show a change in direction. The four 2025 payments declined sequentially from $0.53 to $0.52, $0.51 and $0.49. Payments then rose from $0.49 in January 2026 to $0.52 in April, $0.54 in July and $0.84 in November. The indicated annual dividend is $2.39.
Annual totals have varied with portfolio returns and realized gains. The distribution increased from $0.50 in 2020 to $0.59 in 2021, then rose 176.3% to $1.63 in 2022. It fell 17.2% to $1.35 in 2023 before increasing 31.1% to $1.77 in 2024 and 15.8% to $2.05 in 2025.
That pattern produced a two-year growth streak, while the five-year record equates to 38.8% annual growth. The uneven path is consistent with a fund whose distributions depend partly on investment gains rather than only recurring portfolio income.
Is the dividend covered?
The earnings payout ratio is 26%, indicating that the distribution consumes a limited portion of reported earnings. SmarterDividends rates the dividend B, with a safety score of 77. That places PEO in the safe range of 66-79, meaning the current payment has solid support but retains some exposure to portfolio performance and board policy.
For PEO, the earnings payout ratio does not tell the whole story. The fund can finance distributions with realized capital gains, while the quarterly amount is tied to average NAV. Coverage therefore depends on investment income, the availability of gains and the level of net assets, not just conventional corporate earnings.
Yield and valuation
At a share price of $26.11, PEO’s forward yield is 9.15%, compared with a 6.00% median for the Financial Services sector. The gap is 3.15 percentage points and reflects the fund’s managed distribution structure as well as its exposure to energy and materials.
The shares recorded a 20.1% gain over one year. PEO’s market value is $732 million, placing the yield in the context of a concentrated closed-end sector fund rather than a diversified operating company.
What to watch
The immediate milestone is the December 4, 2026 payment. After that, investors can track the next quarterly declaration for changes in average NAV and the board’s application of its managed distribution policy, which was introduced to make payments more regular. Adams managed distribution policy announcement
Portfolio results remain the central coverage variable. PEO’s largest positions include Exxon Mobil, Chevron and ConocoPhillips, making oil prices, refining margins and energy-company cash generation relevant to future realized gains. The year-end tax statement will also determine how much of the 2026 distributions is classified as investment income, capital gains or return of capital.
PEO dividend data
From the SmarterDividends dataset, updated daily
- Forward yield
- 9.15%
- Payout Ratio
- 26%
- Growth streak
- 2 yrs
- Safety grade
- B · 77/100
| Ex-dividend date | Amount | Change |
|---|---|---|
| Nov 20, 2026 | $0.8400 | +55.6% |
| Jul 27, 2026 | $0.5400 | +3.8% |
| Apr 27, 2026 | $0.5200 | +6.1% |
| Jan 26, 2026 | $0.4900 | +0.0% |
| Nov 21, 2025 | $0.4900 | -3.9% |
| Jul 28, 2025 | $0.5100 | -1.9% |
| Apr 28, 2025 | $0.5200 | -1.9% |
| Jan 27, 2025 | $0.5300 | -1.9% |
Frequently asked questions
When is the PEO dividend payable?
The latest PEO distribution is scheduled for payment on December 4, 2026.
When was PEO’s latest ex-dividend date?
PEO most recently traded ex-dividend on November 20, 2026. The associated distribution is $0.84 per share.
How much is the new PEO dividend per year?
The annual dividend is $2.39 per share. That equals $239.00 in annual income for 100 shares.
Is PEO’s dividend safe?
SmarterDividends rates the dividend B with a safety score of 77, classified as safe within the 66-79 range. The earnings payout ratio is 26%.
What is PEO’s dividend yield?
PEO’s forward yield is 9.15% at a share price of $26.11. The Financial Services sector median forward yield is 6.00%.
Sources
See PEO's full dividend profile
Yield, payout, safety score, history and the next ex-dividend date.
View PEOEvery dividend increases this month, with the data behind it: Dividend Increases, November 2026.
More dividend news

Global Ship Lease Raises Quarterly Dividend 10.1% to $0.688
Global Ship Lease lifts its quarterly payout 10.1% to $0.688, backed by charter coverage, while its safety grade remains borderline amid fleet renewal.

Adams Diversified Equity Fund Raises Dividend 12.0% to $0.56
ADX's quarterly payout rises 12.0% to $0.56, with a 9.34% forward yield, while capital gains and its managed policy shape coverage for shareholders.

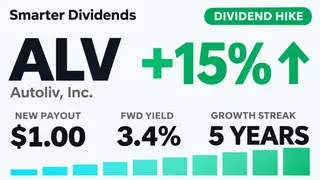
Autoliv Raises Quarterly Dividend 14.9% to $1.00
Autoliv lifted its quarterly dividend 14.9% to $1.00, backed by cash-flow guidance and a five-year run of higher annual payments in a difficult auto market.

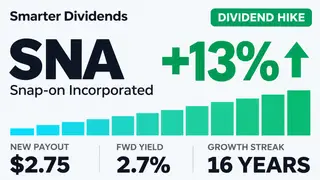
Snap-on Raises Quarterly Dividend 12.7% to $2.75
Snap-on lifted its quarterly dividend 12.7% to $2.75, backed by a 51% earnings payout ratio and an A safety grade despite mixed demand conditions.

Bentley Systems Raises Quarterly Dividend 14.3% to $0.08
Bentley Systems lifts its quarterly dividend to $0.08, backed by a 28% earnings payout ratio, though its 0.64% yield trails the sector median.