

Marsh & McLennan Companies, Inc.
MRSHFinancial Services · Insurance Brokers · Stock · quarterly payer
Forward Yield
2.01%
Annual Dividend
$3.96
Payout Ratio
44%
5-Yr Growth
13.3%
Ex-Date
Oct 1, 2026
Frequency
Quarterly
Key facts about MRSH's dividend
Data as of · Source: SmarterDividends data
- As of Oct 24, 2026, Marsh & McLennan Companies, Inc. (MRSH) has a forward dividend yield of 2.01%, based on an annual dividend of $3.96 per share and a share price of $197.48.
- As of Oct 24, 2026, MRSH's dividend safety grade from SmarterDividends is A (85 out of 100), which rates the dividend as very safe.
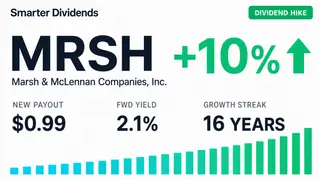
- By SmarterDividends' count, Marsh & McLennan Companies, Inc. (MRSH) has raised its dividend for 16 consecutive years as of Oct 24, 2026.
- MRSH last cut its regular dividend in 2005.
- MRSH's most recent ex-dividend date was Oct 1, 2026, for a dividend of $0.99 per share.
- As of Oct 24, 2026, MRSH pays out 44% of its trailing 12-month earnings as dividends (its payout ratio).
- MRSH's dividend has grown at an average rate of 13.3% a year over the past five years.
- As of Oct 24, 2026, MRSH's 2.01% yield is 38% above its five-year average yield of 1.45%.
- As of Oct 24, 2026, SmarterDividends' blended fair-value estimate for MRSH is $151.88 per share, 23% below the $197.48 share price, so MRSH screens as overvalued.
- Marsh & McLennan Companies, Inc. (MRSH) pays its dividend quarterly, 4 times a year.
- Marsh & McLennan Companies, Inc. (MRSH) has raised its regular dividend 38 times and cut it 1 time across the 176 payments on record since 1983. Its most recent change was a 10.0% increase to $0.990 per share, going ex-dividend on Jul 23, 2026. The last cut went ex-dividend on Mar 11, 2005.
- Marsh & McLennan (MRSH) has declared its first higher dividend of the year in July in 5 of the last 5 years; its most recent raise, 10.0%, was paid from the dividend that went ex-dividend on Jul 23, 2026.
Cite this page
SmarterDividends, "MRSH Dividend: Yield, Safety Grade & Next Ex-Date," updated Oct 24, 2026, https://smarterdividends.com/stocks/MRSH
Summary
As of Oct 24, 2026, Marsh & McLennan Companies, Inc. (MRSH) yields 2.01% ($3.96 a year per share), has a dividend safety grade of A (85/100) and has 16 consecutive years of dividend increases on record.
Is MRSH a good dividend stock?
YesMarsh & McLennan Companies, Inc. (MRSH) pays a quarterly dividend yielding 2.01% ($3.96/yr), with 16 years of growth and a dividend-safety grade of A. It scores well across payout coverage, growth history and safety — a dependable income holding.
Advantages
- 16 consecutive years of dividend growth
- Comfortable payout ratio (44%)
- Strong 13.3% 5-yr dividend growth
- Top-tier dividend safety score
Risks
- Cut its dividend in 2005
Key Data
- Dividend Yield
- 2.01%
- Payout Ratio
- 44%
- Annual Dividend
- $3.96
- 5-Yr Avg Growth
- 13.3%
- Ex-Dividend Date
- Oct 1, 2026
- Years of Growth
- 16
- Frequency
- quarterly
- Beta
- 0.58
- Market Cap
- $94.2B
- P/E Ratio
- 23.6
- 5-Yr Total Return
- 20%
- 52-Week Range
- $156.60 – $200.33
- Dividend Safety
- A · 85/100
- Ever Cut?
- Yes (2005)
MRSH dividend raises and cuts
Marsh & McLennan Companies, Inc. (MRSH) has raised its regular dividend 38 times and cut it 1 time across the 176 payments on record since 1983. Its most recent change was a 10.0% increase to $0.990 per share, going ex-dividend on Jul 23, 2026. The last cut went ex-dividend on Mar 11, 2005.
| Ex-date | Change | Old → new | Move |
|---|---|---|---|
| Jul 23, 2026 | Raise | $0.900 → $0.990 | +10.0% |
| Jul 24, 2025 | Raise | $0.815 → $0.900 | +10.4% |
| Jul 25, 2024 | Raise | $0.710 → $0.815 | +14.8% |
| Jul 26, 2023 | Raise | $0.590 → $0.710 | +20.3% |
| Jul 27, 2022 | Raise | $0.535 → $0.590 | +10.3% |
| Jul 28, 2021 | Raise | $0.465 → $0.535 | +15.1% |
| Jul 24, 2020 | Raise | $0.455 → $0.465 | +2.2% |
| Jul 10, 2019 | Raise | $0.415 → $0.455 | +9.6% |
| Jul 10, 2018 | Raise | $0.375 → $0.415 | +10.7% |
| Jul 7, 2017 | Raise | $0.340 → $0.375 | +10.3% |
| Jul 7, 2016 | Raise | $0.310 → $0.340 | +9.7% |
| Jul 8, 2015 | Raise | $0.280 → $0.310 | +10.7% |
Show all 39 changes since 1984
| Ex-date | Change | Old → new | Move |
|---|---|---|---|
| Jul 9, 2014 | Raise | $0.250 → $0.280 | +12.0% |
| Jul 9, 2013 | Raise | $0.230 → $0.250 | +8.7% |
| Jul 9, 2012 | Raise | $0.220 → $0.230 | +4.5% |
| Jul 7, 2011 | Raise | $0.210 → $0.220 | +4.8% |
| Oct 6, 2010 | Raise | $0.200 → $0.210 | +5.0% |
| Jan 24, 2008 | Raise | $0.190 → $0.200 | +5.3% |
| Jan 22, 2007 | Raise | $0.170 → $0.190 | +11.8% |
| Mar 11, 2005 | Cut | $0.340 → $0.170 | −50.0% |
| Jul 2, 2004 | Raise | $0.310 → $0.340 | +9.7% |
| Jul 7, 2003 | Raise | $0.280 → $0.310 | +10.7% |
| Jul 5, 2002 | Raise | $0.265 → $0.280 | +5.7% |
| Jul 5, 2001 | Raise | $0.250 → $0.265 | +6.0% |
| Jul 6, 2000 | Raise | $0.225 → $0.250 | +11.1% |
| Jul 8, 1999 | Raise | $0.200 → $0.225 | +12.5% |
| Jul 8, 1998 | Raise | $0.167 → $0.200 | +20.0% |
| Jul 9, 1997 | Raise | $0.150 → $0.167 | +11.1% |
| Oct 9, 1996 | Raise | $0.133 → $0.150 | +12.5% |
| Oct 6, 1995 | Raise | $0.121 → $0.133 | +10.3% |
| Jul 5, 1994 | Raise | $0.113 → $0.121 | +7.4% |
| Jul 7, 1992 | Raise | $0.108 → $0.113 | +3.8% |
| Jul 5, 1990 | Raise | $0.104 → $0.108 | +4.0% |
| Oct 4, 1988 | Raise | $0.100 → $0.104 | +4.2% |
| Jun 29, 1987 | Raise | $0.0792 → $0.100 | +26.3% |
| Oct 1, 1986 | Raise | $0.0625 → $0.0792 | +26.7% |
| Apr 2, 1986 | Raise | $0.0563 → $0.0625 | +11.1% |
| Oct 9, 1985 | Raise | $0.0500 → $0.0563 | +12.5% |
| Oct 10, 1984 | Raise | $0.0458 → $0.0500 | +9.1% |
Frequently Asked Questions
Is MRSH a good dividend stock?
Yes. Marsh & McLennan Companies, Inc. (MRSH) pays a quarterly dividend yielding 2.01% ($3.96/yr), with 16 years of growth and a dividend-safety grade of A. It scores well across payout coverage, growth history and safety — a dependable income holding.
Is MRSH undervalued?
Based on a blend of discounted cash flow, a dividend-discount model and an earnings-multiple estimate, MRSH's fair value is about $151.88 versus a $197.48 share price — so it looks overvalued (-23% vs. fair value).
Is MRSH's dividend safe?
MRSH has a dividend-safety grade of A (85/100), based on its payout coverage, free-cash-flow, 16-year growth streak, a dividend cut in 2005, debt and yield-versus-history.
What is MRSH's fair value?
Our blended fair-value estimate for MRSH is about $151.88 per share, about 23% below the current $197.48 price — combining a discounted cash flow, a dividend-discount model and an earnings multiple.
Is MRSH a buy, hold, or sell?
We don't issue formal ratings, but on the data MRSH screens as "yes" and overvalued. Marsh & McLennan Companies, Inc. (MRSH) pays a quarterly dividend yielding 2.01% ($3.96/yr), with 16 years of growth and a dividend-safety grade of A. It scores well across payout coverage, growth history and safety — a dependable income holding. This is research for your own analysis, not investment advice.
Will MRSH cut its dividend?
MRSH earns a dividend-safety grade of A (85/100), and has cut its dividend before (last in 2005). A higher score means lower cut risk based on payout coverage, cash flow and history — but no score guarantees a dividend.
Does MRSH pay a dividend?
Yes. Marsh & McLennan Companies, Inc. pays a quarterly dividend of about $3.96 per share annually, a forward yield of roughly 2.01%.
What is MRSH's dividend yield?
As of Oct 24, 2026, MRSH's forward dividend yield is 2.01%, based on a $3.96 annual dividend and a $197.48 share price.
What is MRSH's dividend per share?
As of Oct 24, 2026, MRSH pays $3.96 per share per year, distributed on a quarterly basis.
What is MRSH's dividend payout ratio?
As of Oct 24, 2026, MRSH's payout ratio is 44% of trailing 12-month earnings — a comfortable level that leaves room to keep raising the dividend.
How many years has MRSH grown its dividend?
As of Oct 24, 2026, MRSH has increased its dividend for 16 consecutive years.
When is the next MRSH ex-dividend date?
As of Oct 24, 2026, MRSH's next ex-dividend date hasn't been announced. The most recent was Oct 1, 2026, for $0.99 per share.
MRSH Price — Last 12 Months
Daily close
Price Return
1 Year
+8%
3 Years
-1%
5 Years
+20%
52-Week Range
$156.60 – $200.33
Price change over each period (excludes dividends). Past performance doesn't guarantee future results.
What is MRSH worth?
Overvaluedmedium confidenceOur blended fair-value estimate for Marsh & McLennan Companies, Inc. is $151.88 per share, versus a market price of $197.48. That implies 23% of downside.
Fair Value
$151.88
Current Price
$197.48
Downside
-23%
Margin of Safety
-30%
How we get there
Dividend discount
Discounts the future dividend stream back to today.
Earnings multiple (Graham)
Graham's earnings-multiple formula, anchored to bond yields.
Assumptions: 8.0% discount rate (CAPM), 9.1% growth for five years fading to 2.5% over the next five, $8.36 EPS, $3.96 annual dividend. Updated weekly.
Fair-value estimates are model output for educational purposes only — not investment advice or a price target.
MRSH Dividend Safety Score
Very Safe
SmarterDividends' proprietary score, backtested against which dividends were actually cut over 15+ years (0.78 AUC). It blends a validated cut-risk model (growth streak, cut history) with current payout, cash-flow and debt. Higher is safer · not investment advice.
Dividend Growth
Total dividends per share by year
Dividend History
Full MRSH dividend history →| Ex-Date | Pay Date | Amount | Type |
|---|---|---|---|
| Oct 1, 2026 | Nov 13, 2026 | $0.9900 | regular |
| Jul 23, 2026 | — | $0.9900 | regular |
| Apr 9, 2026 | May 15, 2026 | $0.9000 | regular |
| Jan 29, 2026 | Feb 13, 2026 | $0.9000 | regular |
| Oct 2, 2025 | Nov 14, 2025 | $0.9000 | regular |
| Jul 24, 2025 | Aug 15, 2025 | $0.9000 | regular |
| Apr 3, 2025 | May 15, 2025 | $0.8150 | regular |
| Jan 30, 2025 | Feb 14, 2025 | $0.8150 | regular |
| Oct 4, 2024 | Nov 15, 2024 | $0.8150 | regular |
| Jul 25, 2024 | Aug 15, 2024 | $0.8150 | regular |
| Apr 3, 2024 | May 15, 2024 | $0.7100 | regular |
| Jan 24, 2024 | Feb 15, 2024 | $0.7100 | regular |
| Oct 5, 2023 | Nov 15, 2023 | $0.7100 | regular |
| Jul 26, 2023 | Aug 15, 2023 | $0.7100 | regular |
Income Calculator
At $3.96 / yr per share
Similar Dividend Stocks




Compare MRSH
Explore more
Lists and tools related to MRSH
- Companies that raise dividends in July →
- Stocks that pay dividends in November →
- Safest dividend stocks →
- Financial Services dividend stocks →
- MRSH dividend calculator →
- MRSH DRIP calculator →
- MRSH: last day to buy for the dividend →
- Embed MRSH dividend data on your site →
- Dividend increases & cuts this week →
- Dividend calendar →
- Dividend calculator →
- Dividend income calculator →
- DRIP calculator →
- Latest dividend cuts →
- Dividend cuts this month (research note) →
- Dividend increases this month (research note) →
- Safety score track record →
- Dividend screener →
- Dividend history lookup →
- Guide: what is a good dividend yield? →
- Guide: how to value a dividend stock →