
SmarterDividends index · monthly since 2000
Dividend Raise Index™
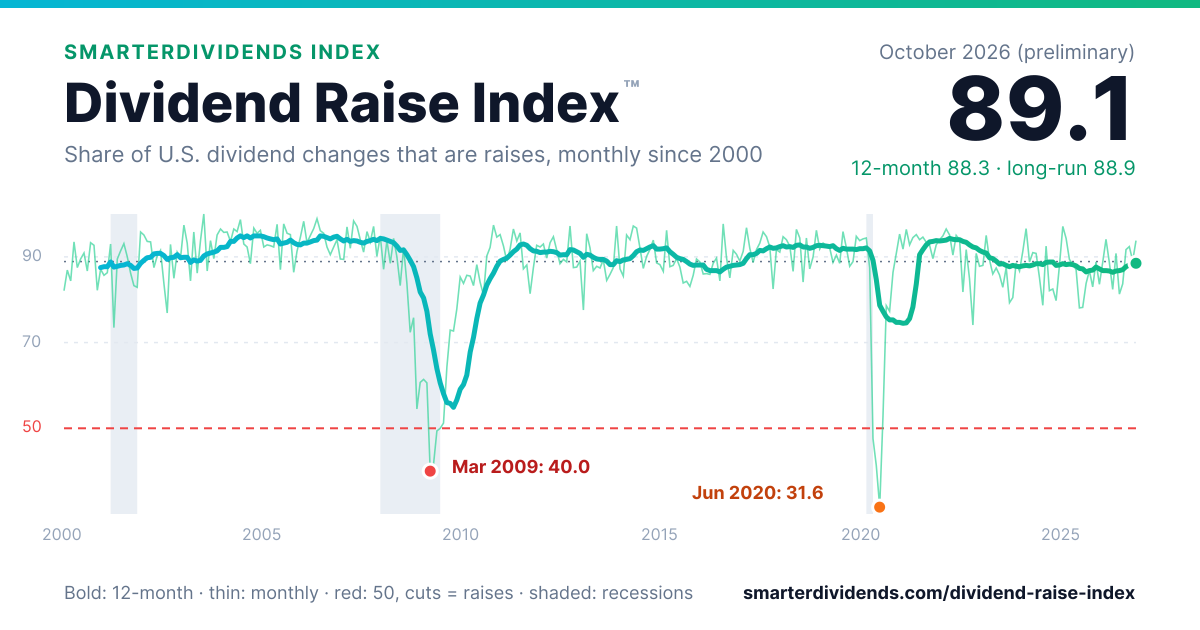
Of every dividend change U.S.-listed companies make in a month, the share that are raises. Around 90 is normal. Below 50, cuts and suspensions outnumber raises: since 2000 that has happened in 6 months, March to May 2009 and April to June 2020.
- Long-run
- 88.9
- since 2000
- Lowest
- 31.6
- Jun 2020
- Changes counted
- 27,968
- 323 months
October 2026preliminary
89.1Healthy
41 raises · 5 cuts
- 12 months
- 88.3 Healthy
- Long-run
- 88.9
- November 2026 so far
- 93.8 (45 raises, 3 cuts)
The SmarterDividends Dividend Raise Index™ read 89.1 for October 2026 (preliminary): 89 of every 100 dividend changes by U.S.-listed companies were raises (41 raises, 5 cuts). The 12-month reading was 88.3, against a long-run reading of 88.9 since 2000.
The Dividend Raise Index, 2000 to today
Updated daily · 27,968 dividend changes counted
Monthly readings are noisy because raises cluster in a few months of the year; the 12-month line is the trend. The last five months are preliminary. Shaded: U.S. recessions (NBER).
Key facts: the Dividend Raise Index
Data as of · Source: SmarterDividends data
- The Dividend Raise Index™, published by SmarterDividends, is the share of dividend changes by U.S.-listed companies in a month that were raises, times 100, where cuts and suspensions are the other changes. A reading of 50 means as many cuts and suspensions as raises.
- The Dividend Raise Index read 89.1 for October 2026 (preliminary), from 41 dividend raises and 5 cuts.
- Over the 12 months to October 2026, the Dividend Raise Index read 88.3.
- Since 2000, the Dividend Raise Index has read 88.9: about 9 in every 10 dividend changes by U.S.-listed companies were raises.
- The Dividend Raise Index's lowest monthly reading since 2000 was 31.6 in June 2020, from 42 raises against 46 cuts and 45 suspensions.
- In the 2008–09 crisis the Dividend Raise Index fell to 40.0 in March 2009 (36 raises, 52 cuts and 2 suspensions).
- Its lowest 12-month reading was 54.9, for the 12 months to October 2009.
- Since 2000, cuts and suspensions outnumbered raises (a reading below 50) in 6 months: March to May 2009 and April to June 2020.
- November 2026 so far (preliminary): 93.8, from 45 raises and 3 cuts.
Cite this page
SmarterDividends, "Dividend Raise Index™: Dividend Raises vs Cuts, Every Month Since 2000," updated 2026-11-12, https://smarterdividends.com/dividend-raise-index
How to read it
88 and up
Raises outnumber cuts by about nine to one or more. Most months since 2000.
75 to 88
More companies trimming. A single month here is common; a run of them is the warning sign.
50 to 75
One change in four or more is a cut or a suspension. Most of late 2008 and 2009.
Below 50
Cuts and suspensions outnumber raises. 6 months since 2000: March to May 2009 and April to June 2020.
The record
Lowest month
31.6
June 2020 · 42 raises, 46 cuts and 45 suspensions
2008–09 low
40.0
March 2009 · 36 raises, 52 cuts and 2 suspensions
Lowest 12 months
54.9
12 months to October 2009
By year
| Year | Raises | Cuts | Suspended | Index |
|---|---|---|---|---|
| 2026prelim. | 1,079 | 110 | 23 | 89.0 |
| 2025 | 1,199 | 139 | 37 | 87.2 |
| 2024 | 1,157 | 117 | 39 | 88.1 |
| 2023 | 1,161 | 124 | 39 | 87.7 |
| 2022 | 1,332 | 100 | 24 | 91.5 |
| 2021 | 1,288 | 76 | 11 | 93.7 |
| 2020 | 875 | 196 | 100 | 74.7 |
| 2019 | 1,118 | 78 | 21 | 91.9 |
| 2018 | 1,198 | 81 | 13 | 92.7 |
| 2017 | 1,065 | 68 | 20 | 92.4 |
| 2016 | 998 | 116 | 18 | 88.2 |
| 2015 | 1,086 | 129 | 17 | 88.1 |
| 2014 | 1,081 | 87 | 9 | 91.8 |
| 2013 | 990 | 114 | 9 | 88.9 |
| 2012 | 902 | 83 | 8 | 90.8 |
| 2011 | 809 | 75 | 5 | 91.0 |
| 2010 | 612 | 67 | 9 | 89.0 |
| 2009 | 430 | 277 | 21 | 59.1 |
| 2008 | 741 | 153 | 12 | 81.8 |
| 2007 | 947 | 53 | 4 | 94.3 |
| 2006 | 934 | 55 | 2 | 94.2 |
| 2005 | 875 | 65 | 3 | 92.8 |
| 2004 | 787 | 41 | 1 | 94.9 |
| 2003 | 664 | 53 | 3 | 92.2 |
| 2002 | 535 | 59 | 2 | 89.8 |
| 2001 | 500 | 60 | 5 | 88.5 |
| 2000 | 502 | 63 | 9 | 87.5 |
Last 24 months
| Month | Raises | Cuts | Index | 12 mo |
|---|---|---|---|---|
| Nov 2026prelim. | 45 | 3 | 93.8 | 88.5 |
| Oct 2026prelim. | 41 | 5 | 89.1 | 88.3 |
| Sep 2026prelim. | 97 | 8 | 92.4 | 88.1 |
| Aug 2026prelim. | 111 | 10 | 91.7 | 87.7 |
| Jul 2026prelim. | 41 | 8(1 susp.) | 83.7 | 87.0 |
| Jun 2026 | 104 | 24(3 susp.) | 81.3 | 86.8 |
| May 2026 | 108 | 11(2 susp.) | 90.8 | 86.7 |
| Apr 2026 | 70 | 15(4 susp.) | 82.4 | 86.4 |
| Mar 2026 | 240 | 31(9 susp.) | 88.6 | 86.7 |
| Feb 2026 | 159 | 10(3 susp.) | 94.1 | 86.8 |
| Jan 2026 | 63 | 8(1 susp.) | 88.7 | 86.8 |
| Dec 2025 | 117 | 23(4 susp.) | 83.6 | 87.2 |
| Nov 2025 | 111 | 14(5 susp.) | 88.8 | 87.6 |
| Oct 2025 | 44 | 9(3 susp.) | 83.0 | 86.9 |
| Sep 2025 | 99 | 15(4 susp.) | 86.8 | 86.8 |
| Aug 2025 | 93 | 18(5 susp.) | 83.8 | 86.5 |
| Jul 2025 | 43 | 12(4 susp.) | 78.2 | 87.2 |
| Jun 2025 | 82 | 23(5 susp.) | 78.1 | 87.3 |
| May 2025 | 107 | 16(4 susp.) | 87.0 | 87.9 |
| Apr 2025 | 68 | 9 | 88.3 | 88.2 |
| Mar 2025 | 219 | 26 | 89.4 | 88.3 |
| Feb 2025 | 149 | 9(3 susp.) | 94.3 | 88.2 |
| Jan 2025 | 67 | 2 | 97.1 | 88.4 |
| Dec 2024 | 123 | 17(3 susp.) | 87.9 | 88.1 |
Methodology
- Universe. U.S.-listed common stocks, REITs, BDCs and partnerships that pay a dividend on a regular schedule (monthly, quarterly, semiannual or annual), one listing per company. Closed-end funds, ETFs, ETNs and trusts that hold other securities are left out.
- Raises and cuts. Each regular payment is compared with the previous comparable payment (for semiannual payers, the same half a year earlier). A move of more than 1% either way is a raise or a cut. Special dividends, first payments, partial stub payments and payments not yet confirmed are not changes.
- Suspensions. A company that misses its next payment (nothing for 2.2 times its usual interval, and at least its interval plus 120 days) while its shares keep trading, and then never pays again or comes back lower, counts as a suspension in the month the missed payment was due. A comeback at the same or a higher amount is treated as a hole in the payment records, and a company that stopped trading (bought out or delisted) is not counted.
- Variable payers. Companies whose payment moves both up and down from one payment to the next (variable-rate partnerships, shippers, payers in a foreign currency) are left out, judged at the time from the payments before each change. A lower variable payment is not a dividend cut.
- The reading. Raises ÷ (raises + cuts + suspensions) × 100, by month. The 12-month reading pools the counts of the 12 months to that month.
- Timing. Rebuilt daily from the full payment record. The last five months are preliminary, because a suspension only shows once a payment is clearly overdue; older months are final.
- Limits. The record covers companies listed today and those we have tracked since, so companies that stopped trading before our records began are missing. Our trading records start in 2024, so a suspension by a company that later disappeared can only be confirmed if it came back lower; both make earlier years, 2008–09 included, read too high. Counts are of companies, not weighted by size.
- Revisions. November 11, 2026: suspensions were added and raises now need the same 1% move as cuts. The launch version counted neither, which read about 1.5 points higher over the long run and missed most of 2020's stress.
Read the launch article, Introducing the Dividend Raise Index™, for what 26 years of readings show.
Use the index
Embed the chart
HTML
<a href="https://smarterdividends.com/dividend-raise-index"><img src="https://smarterdividends.com/dividend-raise-index/chart.png" alt="Dividend Raise Index chart: the share of U.S. dividend changes that are raises, by SmarterDividends" width="600" height="315" loading="lazy"></a>
<p>Source: <a href="https://smarterdividends.com/dividend-raise-index">Dividend Raise Index™, SmarterDividends</a></p>
The image updates daily, so your page always shows the latest reading.
Cite it
Quote
The SmarterDividends Dividend Raise Index™ read 89.1 for October 2026 (preliminary): 89 of every 100 dividend changes by U.S.-listed companies were raises (41 raises, 5 cuts). The 12-month reading was 88.3, against a long-run reading of 88.9 since 2000.
Citation
SmarterDividends. "Dividend Raise Index™." October 2026 reading, retrieved 2026-11-12. https://smarterdividends.com/dividend-raise-index
The index in your inbox, every Saturday
Each Saturday letter carries the latest reading, plus the week's raises and cuts and next week's last days to buy. Free, one email a week.
Frequently asked questions
What is the Dividend Raise Index?
The Dividend Raise Index™ is SmarterDividends' monthly measure of dividend health in the U.S. market. Of every dividend change by a U.S.-listed company in a month (raises, cuts and suspensions), it counts the share that were raises and multiplies by 100. A reading of 89.1 (October 2026) means 89 of every 100 changes were raises.
What is a normal reading?
Since 2000 the index has read 88.9 overall, and about 64% of months land between 85 and 95: raises usually outnumber cuts and suspensions by around eight or nine to one. Below 50, when cuts and suspensions outnumber raises, has happened in 6 months: March to May 2009 and April to June 2020.
What was the lowest reading?
31.6 in June 2020, with 42 raises against 46 cuts and 45 suspensions. In the 2008–09 crisis the low was 40.0 in March 2009. The 12-month reading bottomed at 54.9 in the 12 months to October 2009.
Does a suspended dividend count?
Yes. A company that stops paying while its shares keep trading counts as a suspension, in the month the missed payment was due, alongside the cuts. If it later comes back at the same or a higher amount, the gap is treated as a hole in the payment records instead. Because a missed payment is only certain a few months later, the last five months are preliminary and can still move down.
Which companies are included?
U.S.-listed common stocks, REITs, BDCs and partnerships that pay a dividend on a regular schedule, one listing per company. Closed-end funds, ETFs, ETNs and trusts that hold other securities are left out, as are payers whose amount moves both ways from one payment to the next (variable payers), because a lower variable payment is not a cut.
When is it updated?
Every day, from the full payment record. The last five months are preliminary, because a suspension only shows once a payment is clearly overdue; older months are final. A corrected payment record can still move a past reading slightly.
Can I use the index in an article or report?
Yes, with credit. Cite it as "Dividend Raise Index™, SmarterDividends" and link to https://smarterdividends.com/dividend-raise-index. The chart image, the CSV and the API are free under CC BY 4.0.
Related
Dividend Raise Index™ is a trademark of SmarterDividends. Data: SmarterDividends, rebuilt daily from public dividend records. For information only, not investment advice.