
Introducing the Dividend Raise Index™: 26 Years of Raises, Cuts and Suspensions in One Number
By SmarterDividends Team · November 11, 2026 · Updated November 11, 2026
Updated November 11, 2026: the index now counts suspended dividends alongside cuts, and a raise needs the same 1% move as a cut. The figures below use the revised method.
Every month, a few hundred U.S.-listed companies change their dividend. Most raise it. Some cut it, and in a bad month some stop paying altogether. The Dividend Raise Index™ turns that into one number: of all the dividend changes in a month, the share that were raises, times 100.
For October 2026 it read 89.1: 41 companies raised their dividend and 5 cut it. That reading is preliminary, for reasons explained below. Over the 12 months to October it read 88.3. Since January 2000 it has read 88.9, so close to nine in every ten dividend changes are raises.
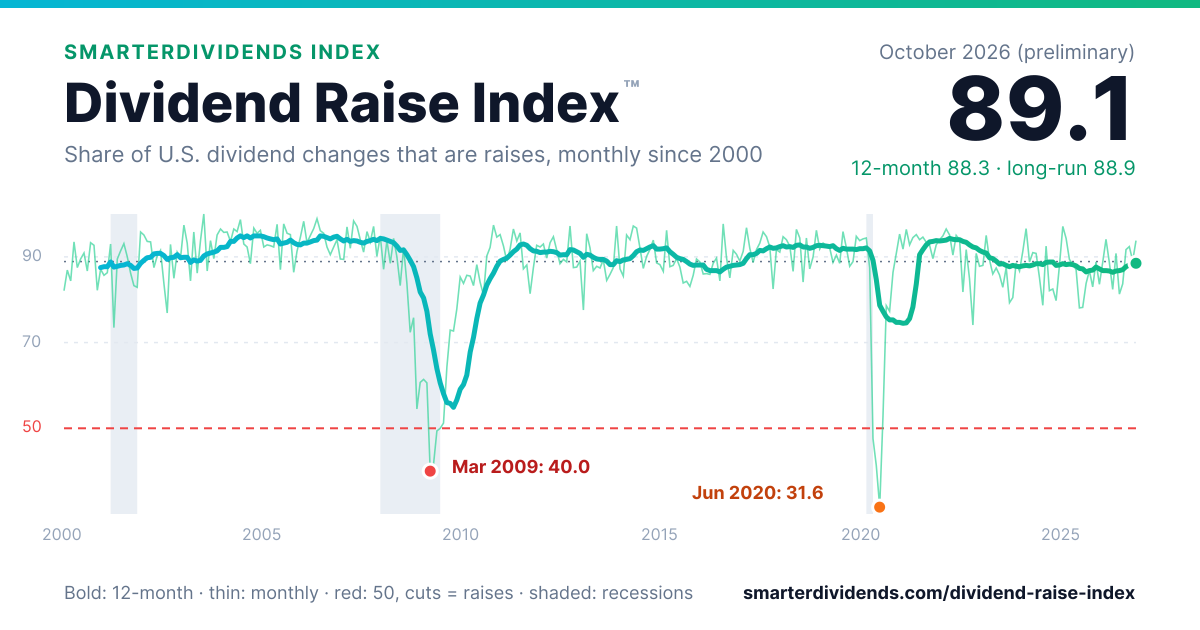
Below 50, cuts and suspensions outnumber raises. Since 2000 that has happened in six months: March to May 2009, and April to June 2020.
Why we built it
Lists of dividend raises and cuts are long, and a list doesn't tell you whether a month was good or bad. Twenty cuts in a month with 300 raises is a healthy month. Twenty cuts in a month with 30 raises is a crisis.
The index answers one question: are companies, as a group, more willing to raise their dividend or more likely to cut or stop it? Sometimes it warns early. In 2008 the monthly reading slipped below 88 four times between June and October, and the 12-month reading fell from 94.2 in January to 87.7 in October, before the worst of the cuts. Sometimes it can't: in January and February 2020 it read above 94.
We already track the dividends paid by U.S.-listed companies, most of them back to around 1970, and we already classify every payment as a raise, a cut, a special or unchanged. The index is that work, counted.
What 26 years show
Normal is close to 90. About two-thirds of months land between 85 and 95. The best full years were 2004 (94.9), 2006 and 2007 (94.3 each). The calm years 2017 to 2019 read between 91.9 and 92.7.
2008–09 was a long dividend recession. The monthly reading fell to 40.0 in March 2009, when 52 companies cut, 2 suspended and 36 raised, and stayed below 50 through May. The 12-month reading fell to 54.9 in the 12 months to October 2009, and it took 14 months from that low to get back to the long-run level, in December 2010.
2020 was the sharpest month on record, and the shortest dividend recession. In June 2020, 42 companies raised their dividend, 46 cut it and 45 suspended it, for a reading of 31.6, the lowest since 2000. Suspensions are what made 2020 different: over the year, 100 companies stopped paying, against 21 in 2009 by the same count. But the recovery was fast. The 12-month reading bottomed at 74.4 in January 2021 and was back above the long-run level by June 2021, five months later.
| Year | Raises | Cuts | Suspended | Index |
|---|---|---|---|---|
| 2007 | 949 | 53 | 4 | 94.3 |
| 2008 | 742 | 153 | 12 | 81.8 |
| 2009 | 431 | 277 | 21 | 59.1 |
| 2010 | 612 | 67 | 9 | 89.0 |
| 2019 | 1,118 | 78 | 21 | 91.9 |
| 2020 | 871 | 196 | 100 | 74.6 |
| 2021 | 1,288 | 76 | 11 | 93.7 |
| 2025 | 1,199 | 139 | 37 | 87.2 |
One caution on 2009 against 2020: our trading records start in 2024, so a 2009 suspension by a company that has since disappeared can only be counted if it later paid again at a lower rate. The 2009 suspension count, and the 2009 readings, are probably too kind. The full table is on the index page.
Where it stands now
The index read 89.1 for October 2026 and 88.3 for the 12 months to October, right around the long-run reading of 88.9. November so far reads 93.8, from 45 raises and 3 cuts.
In plain terms: U.S. companies are raising their dividends at a normal-to-good pace, and cuts are rare. The last five months are preliminary, though, because a suspension only shows up once a payment is clearly overdue, about four months after it was due. Recent readings can still move down.
How to use it
- As a dividend-health gauge. A single soft month means little, because raises cluster in a few months of the year. A run of months below about 88, with the 12-month line turning down, is what 2008 looked like on the way into the worst of the cuts. Not every crisis announces itself: 2020 didn't.
- Against your own holdings. When the index is falling, check which of your stocks pay out more than they earn. Our dividend safety grades flag the ones most at risk.
- Each month. The reading updates daily, and the latest one goes out in our free Saturday email.
How it's built
The index counts U.S.-listed common stocks, REITs, BDCs and partnerships that pay on a regular schedule, one listing per company. It leaves out closed-end funds, ETFs and ETNs.
- Raises and cuts. Each regular payment is compared with the previous comparable one. A move of more than 1% either way is a raise or a cut. Specials, first payments and partial stub payments don't count.
- Suspensions. A company that misses its next payment while its shares keep trading, and then never pays again or comes back lower, counts as a suspension in the month the missed payment was due. A comeback at the same or a higher amount is treated as a gap in the payment records, and a company that was bought out or delisted isn't counted.
- Variable payers. Companies whose payout moves both up and down from one payment to the next (variable-rate partnerships, shippers, payers in a foreign currency) are left out, judged at the time of each change, because a lower variable payment is not a dividend cut.
Two limits are worth knowing. The record covers companies listed today and those we have tracked since, so companies that disappeared before our records began are missing; that, and the trading-record limit above, likely make the early years read too high. And the index counts companies, not dollars, so a cut by a giant counts the same as a cut by a small bank.
The full method is on the index page.
Free to use
The chart, the monthly CSV and the JSON API are free under CC BY 4.0. If you write about dividends, you can embed the chart. It updates itself, so your page always shows the latest reading. Credit "Dividend Raise Index™, SmarterDividends" with a link to the index page.
Data as of November 11, 2026. Past readings don't predict future ones. For information only, not investment advice.
The dividend market by the numbers
Data as of · Source: SmarterDividends data
- As of Nov 12, 2026, SmarterDividends tracks 3,066 U.S.-listed stocks, ETFs and funds that pay a dividend.
- As of Nov 12, 2026, the median forward dividend yield among U.S.-listed dividend-paying stocks with a market value of at least $500 million is 2.48%.
- As of Nov 12, 2026, 110 U.S.-listed stocks in SmarterDividends' data have raised their dividend for 25 or more consecutive years.
- In the 30 days to Nov 12, 2026, 149 U.S.-listed companies raised their regular dividend and 1 cut it, by ex-dividend date. That is 149.0 increases for every cut.
- In the seven days from Nov 12, 2026, 519 U.S.-listed dividend payers tracked by SmarterDividends have an ex-dividend date.
Cite this page
SmarterDividends, "Introducing the Dividend Raise Index™: 26 Years of Raises, Cuts and Suspensions in One Number," updated Nov 12, 2026, https://smarterdividends.com/blog/introducing-the-dividend-raise-index
Frequently Asked Questions
What is the Dividend Raise Index?
The Dividend Raise Index™ is a monthly measure published by SmarterDividends: of every dividend change by U.S.-listed companies in a month (raises, cuts and suspensions), the share that were raises, times 100. A reading of 50 means as many cuts and suspensions as raises. It read 89.1 for October 2026 (preliminary), and 88.9 over all final months since January 2000.
What was the lowest Dividend Raise Index reading?
31.6 in June 2020, when 42 U.S.-listed companies raised their dividend, 46 cut it and 45 suspended it. In the 2008–09 crisis the low was 40.0 in March 2009. Since 2000 the index has been below 50 in six months: March to May 2009 and April to June 2020.
Does the Dividend Raise Index count suspended dividends?
Yes. A company that stops paying while its shares keep trading counts as a suspension in the month its missed payment was due, alongside the cuts. Because a missed payment is only certain a few months later, the last five months of the index are preliminary.
Can I use the Dividend Raise Index in my own work?
Yes. The chart, the monthly CSV and the JSON API are free under CC BY 4.0. Credit "Dividend Raise Index™, SmarterDividends" and link to smarterdividends.com/dividend-raise-index.
Track your dividend income
Build a portfolio, project a year ahead, and see every upcoming payment. It's free.
Open the dashboardFor informational purposes only. Not investment advice.